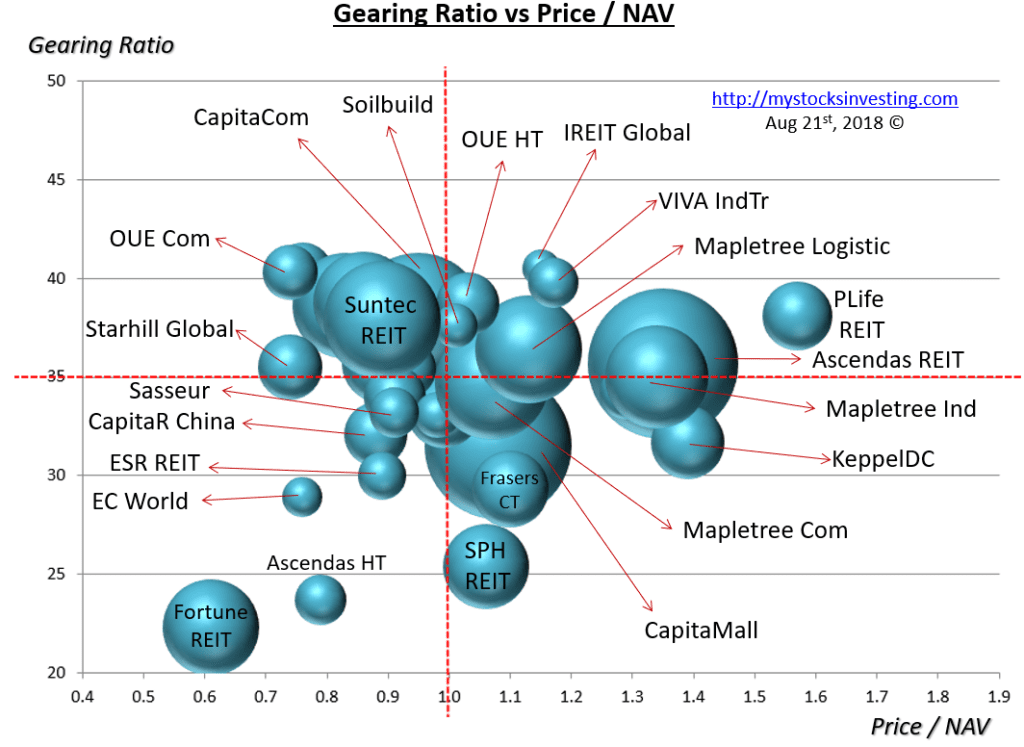
Bubble charts derived from Aug 6, 2018 Singapore REITs Fundamental Comparison Table. Two observations compared to last Bubble Charts.
(1) No significant changes in term of Price/NAV and distribution yield.
(2) There are significant reduction of gearing ratio for Ascendas HT and Fortune REIT based on the latest earning release. These two REITs are under value and also have more debt room for new acquisition.
These Bubble Charts are used to show the “relative” position compare to other Singapore REITs.
Two visual bubble charts to pick and avoid:
- Undervalue Singapore REITs with High Distribution Yield** (Value Pick)
- Overvalue Singapore REITs with High Gearing Ratio (Risk Avoidance)
** Distribution Yield are lagging.
Compared to previous Singapore REIT Bubble Charts here.
Disclaimer: The analysis is for Author own use and NOT to be used as Buy / Sell recommendation. Get a proper training on “How to use this Singapore REIT Bubble Charts?” here.
I will be sharing on how to use these Bubble Charts to identify investment opportunities in the coming INVEST Fair on Aug 26.
You can register the event by clicking HERE or https://goo.gl/jPWHeu and enter promo-code MYSTOCKSINVESTING to have 3x chances to win the lucky draw. We chat more if you can catch me at INVEST Fair, see you!
KENNY LOH
Original Post from https://mystocksinvesting.com
- If you prefer to DIY your REITs Portfolio by selecting the right REITs for long term investing, you may consider the practical hands on REITs Investing Course.
- If you do not have time to do all the analysis and monitor the stock market, there is a solution for you … REITs Portfolio Advisory. I will help you to build a Diversified REITs portfolio for you. I will do all the work by selecting fundamental strong REIT, time the entry, monitor the quarterly earning performance, sell the weak REITs, etc. https://mystocksinvesting.com/course/private-portfolio-review/
- Singapore REITs is considered a Listed Alternative Investment. Read here why you should include a Non Market Correlated Alternative Investment in your investment portfolio to reduce volatility.
Also see other courses and seminars below.


