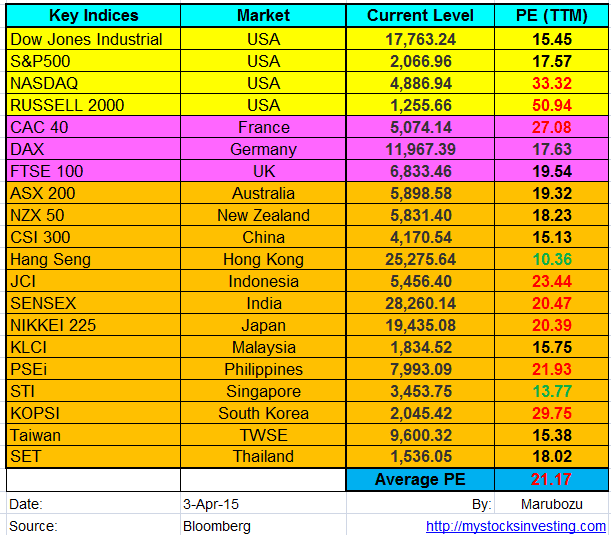
Market Indices PE Ratio for Major Stock Exchange globally
- US: Dow Jones Industrial, S&P500, NASDAQ, Russell 2000
- Europe: FTSE100, CAC40, DAX
- Asia: KLCI, STI, HangSeng, ASX200, CSI 300, JCI, SET, KOPSI, NIKKEI 225, SENSEX, TWSE, NZX50, PSEi
Dow Jones Industrial, S&P500 and NASDAQ are in the sideway consolidation mode but still above 200D SMA. Average PE ratio no change at 21.17. Most of the stock market now are overvalue now. Watch out for the seasonal pattern – Sell in May and Go away. VIX closed at 14.67 for Mar 2015.
See Feb 2015 Global Stock Market PE Ratio here.
- PE = Price Per Earning
- PB = Price To Book Value
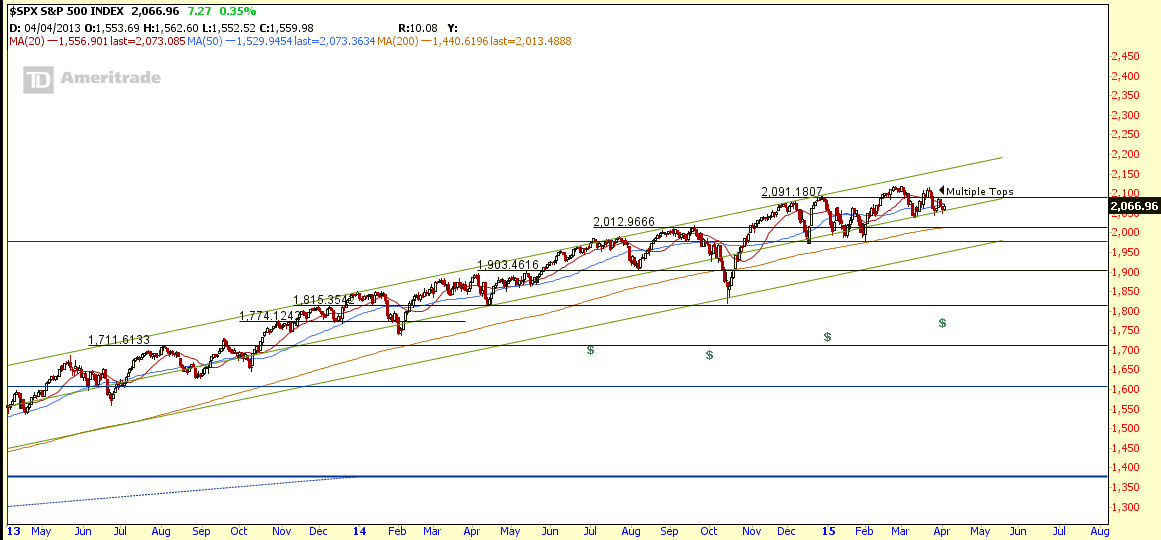
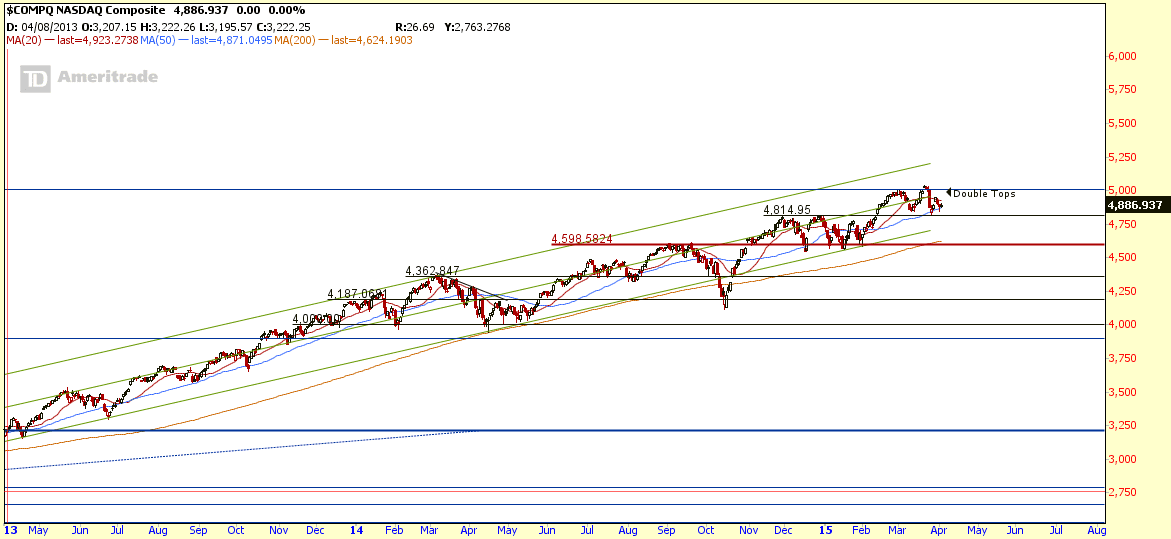
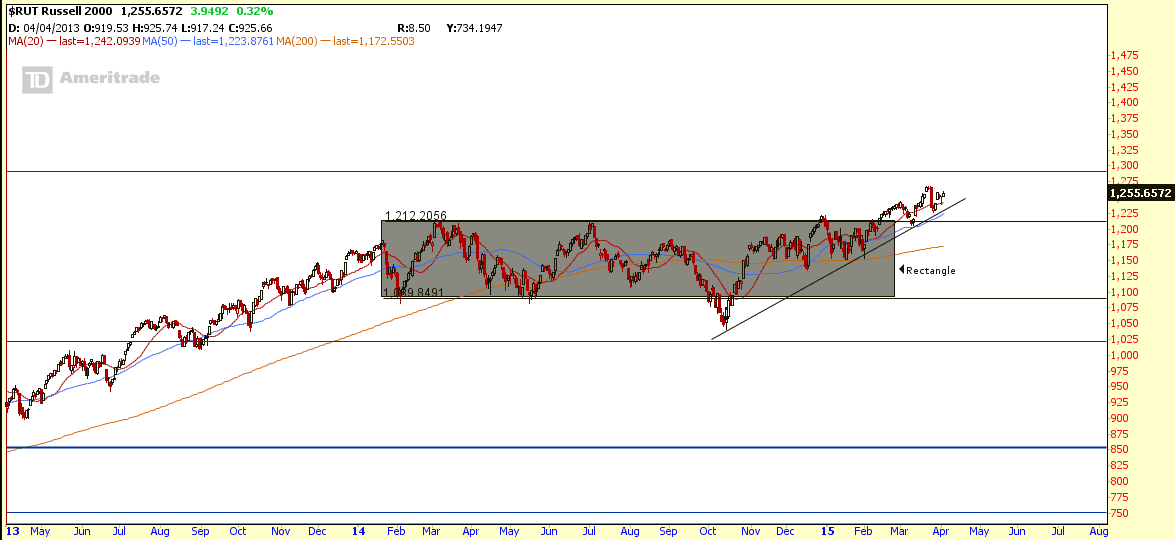
Dow Jones Industrial, S&P500, NASDAQ, Russel 2000 Charts
- INDU, SPX, COMP are still on uptrend but showing dangerous reversal chart pattern. Currently INDU & SPX are forming multiple tops; COMP is showing Double Tops pattern.
- RUT broke out from the Rectangle and starts an new up trend.
Past 1 Month Sector Performance
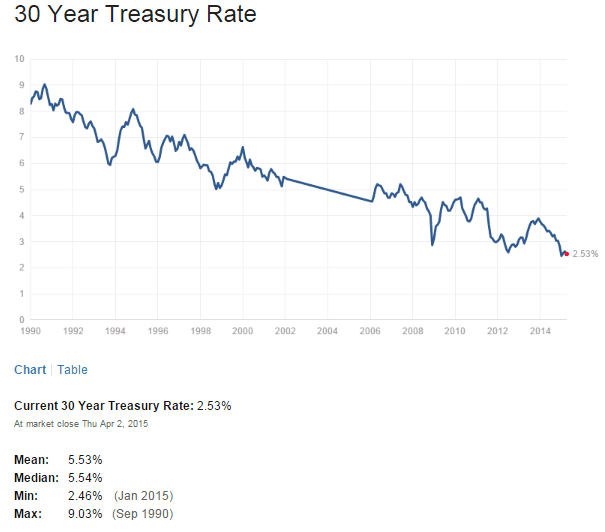
Treasury Yield
Yield Curve
If you want to understand how to conduct the above stock market analysis, how and where to find the free (and right) data from internet, how to analyse the data, how to combine all the analysis to form an own opinion to predict the stock market next moment? How to use the Yield Curve to anticipate the stock market movement. Check out the Fundamental Analysis Class here.






i need march month update for Global Stock Market Indices PE Ratio At a Glance
from where i can get this update?
i will be waiting for your reply.
thanks
@vinita: You can get the data from bloomberg.