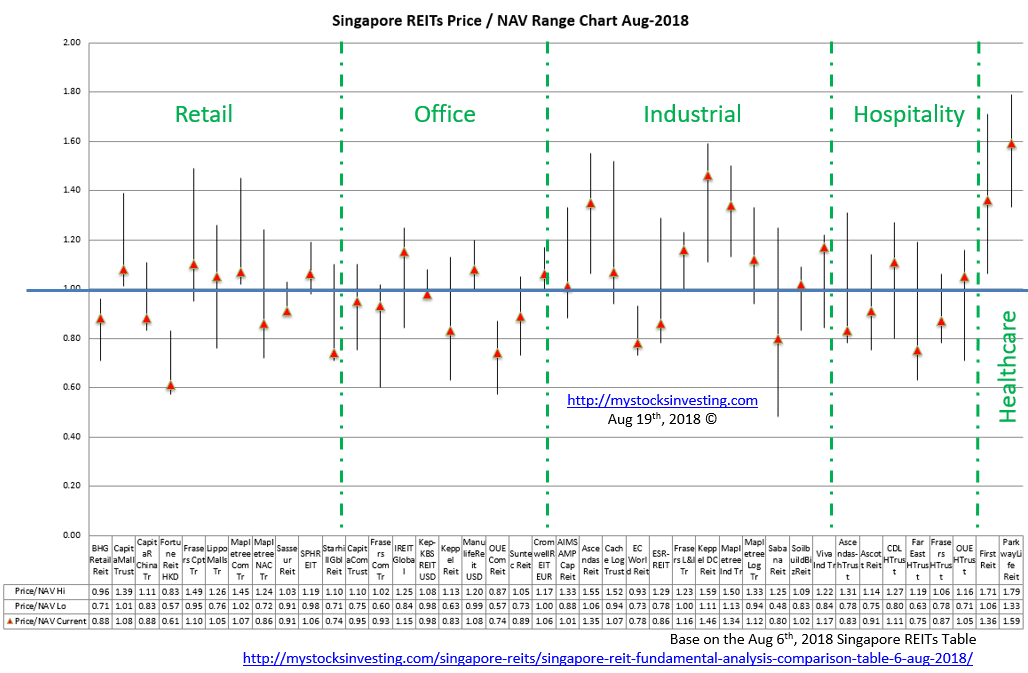
Singapore REIT Fundamental Analysis Comparison Table – 1 July 2018

  • Post author:

FTSE ST Real Estate Investment Trusts (FTSE ST REIT Index) decreases from  800.42 to 786.10 (-1.79%) as compared to last post on Singapore REIT Fundamental Comparison Table on June 1, 2018.  The REIT index has broken the 800 support and all 3 Moving Averages are turning down. This is a signal of bearish down trend.   The REIT Index has rebounded from a Resistance Turned Support and is currently testing the 20D SMA resistance. If this support zone is broken, the REIT index will continue to slide down to around 742 level.

Fundamental Analysis

  • Price/NAV decreases from 1.02 to 1.00 (Singapore Overall REIT sector is at fair value now).
  • Distribution Yield increases from 6.64% to 6.76% (take note that this is lagging number). About one third of Singapore REITs (15 out of 40) have Distribution Yield > 7%.
  • Gearing Ratio stays at 34.7%.  20 out of 40 have Gearing Ratio more than 35%. In general, Singapore REITs sector gearing ratio is healthy.
  • Most overvalue REIT is Parkway Life (Price/NAV = 1.58), followed by Keppel DC REIT (Price/NAV = 1.42), First REIT (Price/NAV = 1.31) and Mapletree Industrial Trust (Price/NAV = 1.31).
  • Most undervalue (base on NAV) is Fortune REIT (Price/NAV = 0.65), followed by  Starhill Global REIT (Price/NAV = 0.71), Far East Hospitality Trust (Price/NAV = 0.73), OUE Comm REIT (Price/NAV = 0.76) and EC World REIT (Price/NAV = 0.77).
  • Highest Distribution Yield (TTM) is Lippo Mall Indonesia Retail Trust (10.22%), followed by SoilBuild BizREIT (8.53%), Viva Industrial Trust (8.54%), Cromwell European REIT (8.49%), EC World REIT (8.27%), Sasseur REIT (8.22%) and Cache Logistic Trust (8.37%).
  • Highest Gearing Ratio are OUE Comm REIT (40.5%), iREIT Global (40.5%) and Soilbuild BizREIT (40.2%).

Disclaimer: The above table is best used for “screening and shortlisting only”. It is NOT for investing (Buy / Sell) decision. To learn how to use the table and make investing decision, Sign up next REIT Investing Seminar here to learn how to choose a fundamentally strong REIT for long term investing for passive income generation.

  • 1 month increases from 1.38291% to 1.40050%
  • 3 month increases from 1.50704% to 1.52038%
  • 6 month increases from 1.65446% to 1.66171%
  • 12 month increases from 1.84604% to 1.85065%

Summary

Fundamentally the whole Singapore REITs is at fair value now.  Overall yield for Singapore REIT is still attractive (average yield of 6.76%). Yield spread (reference to 10 year Singapore government bond) is 4.23%. DPU yield for a number of small and mid cap REITs are quite attractive at the moment.  However, technically, the REIT index is currently trading on downtrend and more down side is expected in the near term. It is time to get our watch list ready if the REIT sectors continue to correct to an attractive entry level.


REIT in Singapore is considered a Listed Alternative Investment. I will be inviting Sani Hamid to give a current market outlook and share his strategy on How to Safeguard Your Portfolio Using Regulated Alternative Investment.  This is an exclusive private event for my blog readers, my students and my guests. Registration is compulsory as seats are limited. Please register online here https://www.eventbrite.sg/e/how-to-safeguard-your-portfolio-using-regulated-alternative-investments-tickets-47455131576


See all other relevant  Singapore REITs blog posts here.

If you need an independent professional review on your current REIT portfolio and need any recommendation, you may engage me in the REIT portfolio Advisory. REITs Portfolio Advisory.  https://mystocksinvesting.com/course/private-portfolio-review/

Continue ReadingSingapore REIT Fundamental Analysis Comparison Table – 1 July 2018

Singapore REIT Index Hit by Bear! Panic Sell or Good Time To Buy?

  • Post author:

Singapore REIT index has dropped about 11.5% since peaking in Jan 2018. Singapore REIT Index continues the down trend but currently may be finding a temporary support at Resistance Turned Support zone. Singapore REIT sector may fall further if this support is broken. Based on valuation, there are more room to drop further for some REITs but some REITs are closed to attractive entry level.

By the way, I have given a warning since Feb 2018 in my blog post and my seminars.

See previous blog post here. https://mystocksinvesting.com/singapore-reits/singapore-reit-fundamental-analysis-comparison-table-12-feb-2018/


If you have the following questions, or do not know what to do, or need a second opinion on your plan,  you may engage an unbiased 3rd party and independent REIT portfolio review (advisory fee applied). Send your inquiry to marubozu@mystocksinvesting.com

  • Should I sell now and buy back later?
  • Should I buy more now?
  • Should I sell everything and park in cash?
  • How low can REIT sector go?
  • Are there better opportunities at the moment besides REITs?
  • When is the good time to buy REITs again?
  • Which REIT sectors should I invest in?
  • How to select Fundamentally strong REITs to invest for long term?
Continue ReadingSingapore REIT Index Hit by Bear! Panic Sell or Good Time To Buy?

Singapore REIT Bubble Charts June 2018

  • Post author:

Bubble charts derived from June 1, 2018 Singapore REITs Fundamental Comparison Table. Two observations compared to last Bubble Charts.

(1) The continued selling for Singapore REITs shift the bubbles to the left (slightly lower Price/NAV).

(2) Yield spread between Big cap and small cap has started to tigthen a little bit. Yield for a number of REITs have started to move up.

Disclaimer: The analysis is for Author own use and NOT to be used as Buy / Sell recommendation. Get a proper training on “How to use this Singapore REIT Bubble Charts?” here.

Original Post from https://mystocksinvesting.com


These Bubble Charts are used to show the “relative” position compare to other Singapore REITs.

Two visual bubble charts to pick and avoid:

  1. Undervalue Singapore REITs with High Distribution Yield** (Value Pick)
  2. Overvalue Singapore REITs with High Gearing Ratio (Risk Avoidance)

** Distribution Yield are lagging.


Compared to previous Singapore REIT Bubble Charts here.


Also see other courses and seminars below.

https://mystocksinvesting.com/events/

Continue ReadingSingapore REIT Bubble Charts June 2018