Sorry for the late Singapore REIT monthly update. I decided to delay the posting due to 2 reasons:
- Market is going through a correction. It is better to wait for the price to settle down for a better reflection of the Prive/NAV valuation and yield.
- I was busying meeting my students so that I can complete the private 1 on 1 portfolio review before Chinese New Year. In the consultation session, I advise my students how can they optimize return of their investment portfolio and at the same time reduce their portfolio risks if there is a big market correction.
Technical Analysis
FTSE ST Real Estate Investment Trusts (FTSE ST REIT Index) sharp dropped from 855.88 to 805.48 (-5.89%) compare to last post on Singapore REIT Fundamental Comparison Table on Jan 1, 2017. Uptrend is over after the index broke the uptrend channel support. There is also an early warning that the index can go lower as the 20D SMA is going to cross down 50D SMA, based on previous patterns in May 2015 and Nov 2016. The index also broke the 200D SMA support and currently clinging on the last defence at 800 support.

Fundamental Analysis

- Included Cromwell European REIT and Keppel KBS REIT in the table. Total 39 REITs in Singapore Exchange.
- Price/NAV decreases from 1.08 to 1.04 (Singapore Overall REIT sector is still over value now after the recent sell off).
- Distribution Yield increases 6.38% to 6.54% (take note that this is lagging number). About one third number of Singapore REITs (11 out of 39) have Distribution Yield > 7%.
- Gearing Ratio increases from 34.2%. to 34.4%. 19 out of 37 have Gearing Ratio more than 35%. In general, Singapore REITs sector gearing ratio is healthy.
- Most overvalue REIT is Parkway Life (Price/NAV = 1.58), followed by Keppel DC REIT (Price/NAV = 1.44), First REIT (Price/NAV = 1.34) and Mapletree Industrial Trust (Price/NAV = 1.36).
- Most undervalue (base on NAV) is Fortune REIT (Price/NAV = 0.65), Sabana REIT (Price/NAV = 0.71) and OUE Comm REIT (Price/NAV = 0.77)
- Highest Distribution Yield (TTM) is Lippo Mall Indonesia Retail Trust (8.8%), followed by SoilBuild BizREIT (8.79%), Sabana REIT (8.6%), Viva Industrial Trust (8.35%) and Cache Logistic Trust (8.02%).
- Highest Gearing Ratio are iREIT Global (41.7%) and Soilbuild BizREIT (40.6%)
Disclaimer: The above table is best used for “screening and shortlisting only”. It is NOT for investing (Buy / Sell) decision. To learn how to use the table and make investing decision, Sign up next REIT Investing Seminar here to learn how to choose a fundamentally strong REIT for long term investing for passive income generation.
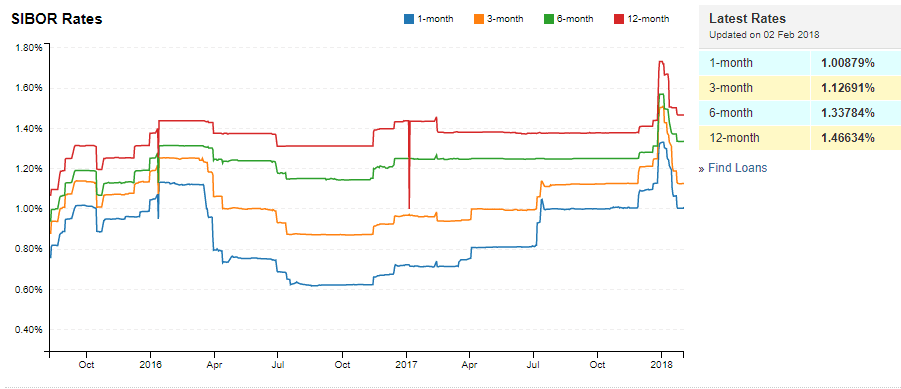
- 1 month decreases from 1.12375% to 1.00879%
- 3 month decreases from 1.24325% to 1.12691%
- 6 month increases from 1.31183% to 1.33784%
- 12 month increases from 1.43917% to 1.46634%
Summary
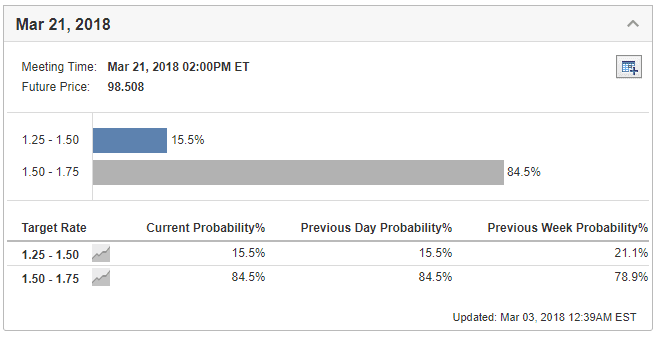
Fundamentally the whole Singapore REITs is still over value now after the recent sell off. Overall yield for Singapore REIT is still attractive but we have to watch closely the US interest rate hike and the risk free 10 Year Treasury Yield. The yield spread is narrowing compared to 1 year ago.
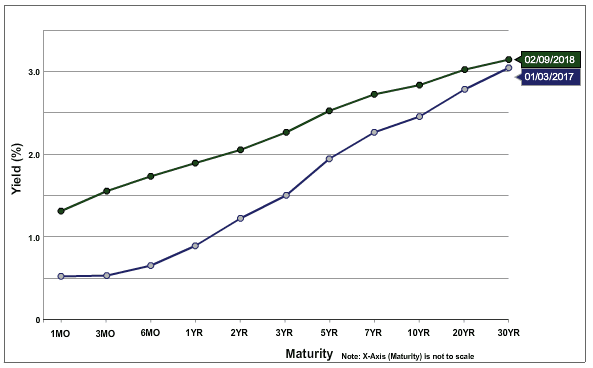
I also warned against the potential sharp drop of FTSE ST REIT Index on Jan 22, 2018 (Online Traders Club Singapore) OTCS event at SGX based on valuation, technical analysis and cyclical nature of REIT sector. You can find the following slides below.


No one can predict the market but there are warning signs on the Singapore REIT sector. My focus is purely on the FTSE ST REIT index chart now to see whether the last 800 support can be hold.
Safe investing in 2018!
See all other relevant Singapore REITs blog posts here.
Check out coming seminars at https://mystocksinvesting.com/events