Singapore REIT Fundamental Analysis Comparison Table July 12 – 2020
Technical Analysis of FTSE ST REIT Index (FSTAS8670)
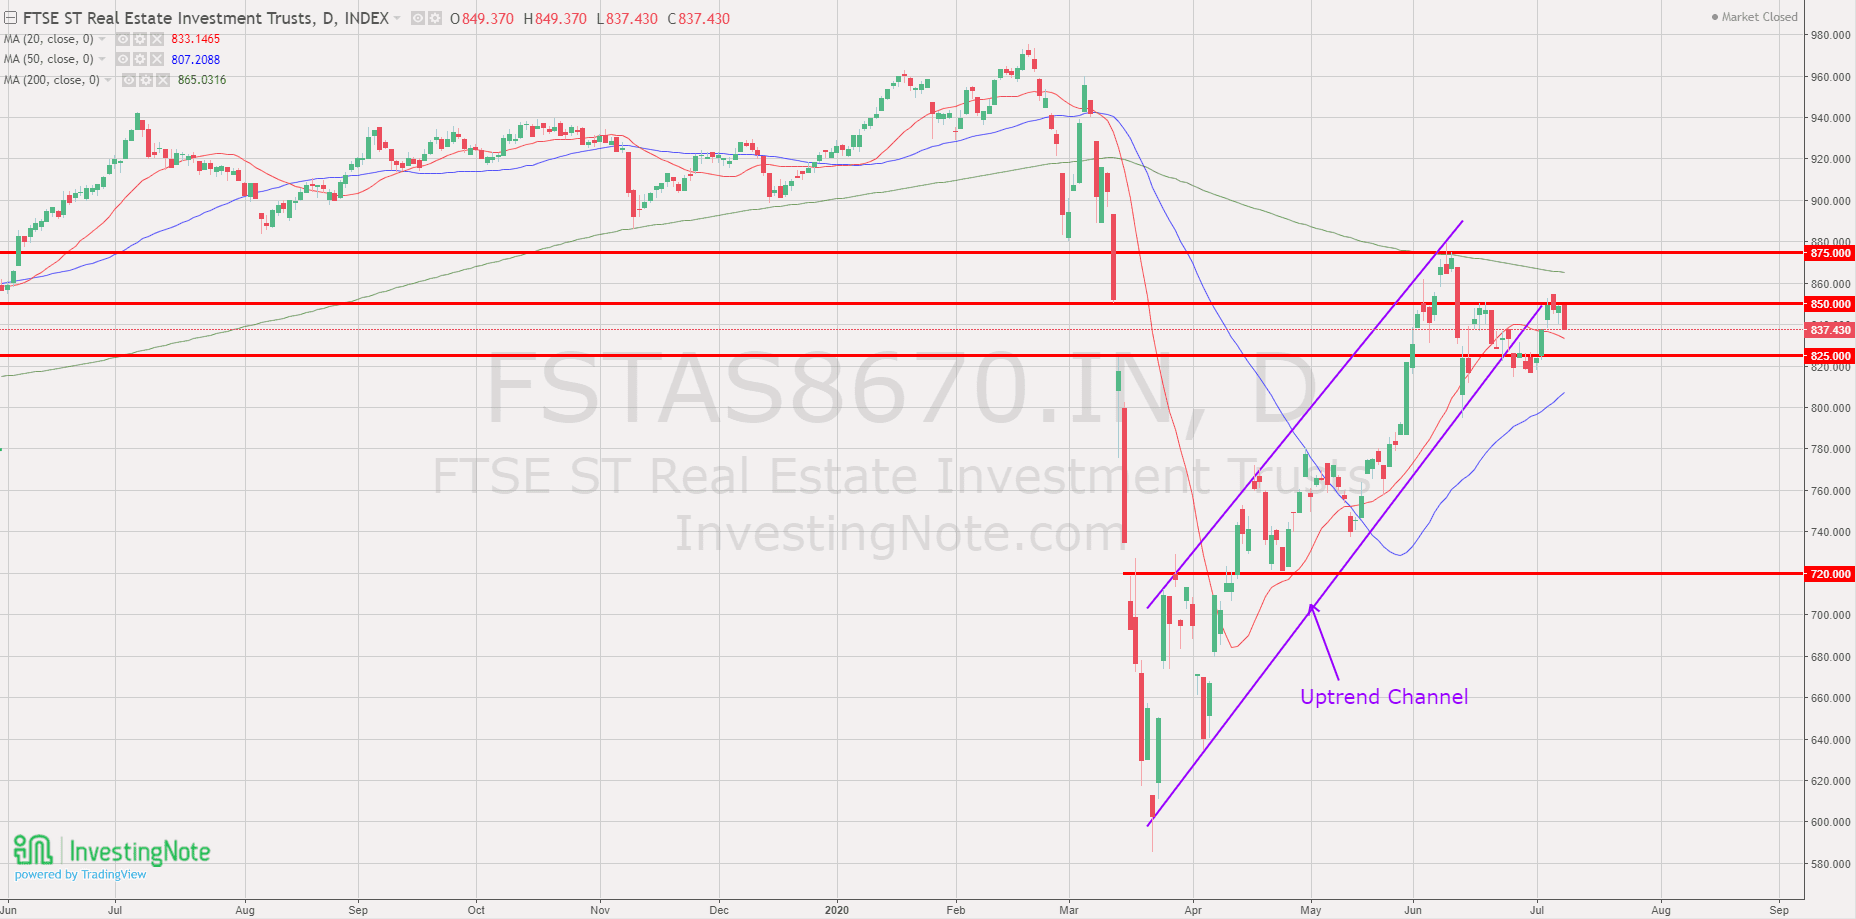
FTSE ST Real Estate Investment Trusts (FTSE ST REIT Index) changes from 823.64 to 837.43 (+1.67%) compared to last month update. REIT Index has rebounded c43% as of July 12 from the bottom on Mar 23, 2020.
Currently the REIT index is currently trading on sideway consolidation, sandwiched between 200D SMA and 50D SMA. Immediate support at about 825 (Gap support) followed by 50D SMA. Immediate resistance at 200D SMA.
Short term direction: Sideway.
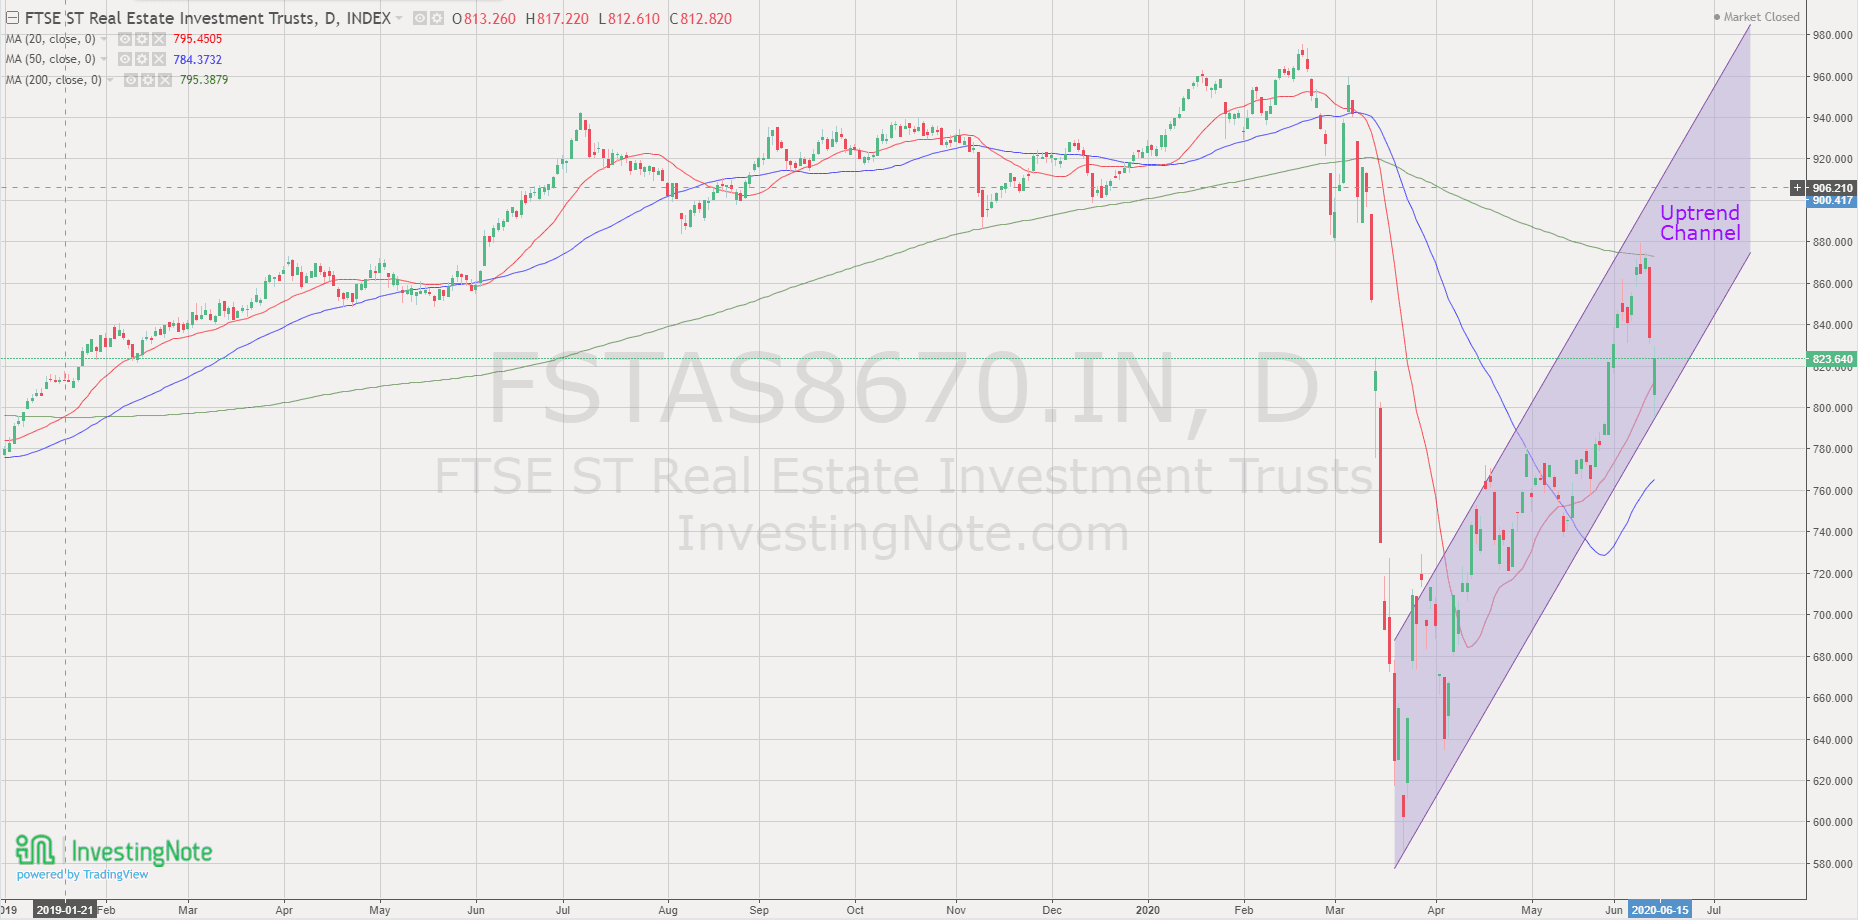
Previous chart on FTSE ST REIT index can be found in the last post Singapore REIT Fundamental Comparison Table on June 15, 2020.
Fundamental Analysis of 40 Singapore REITs
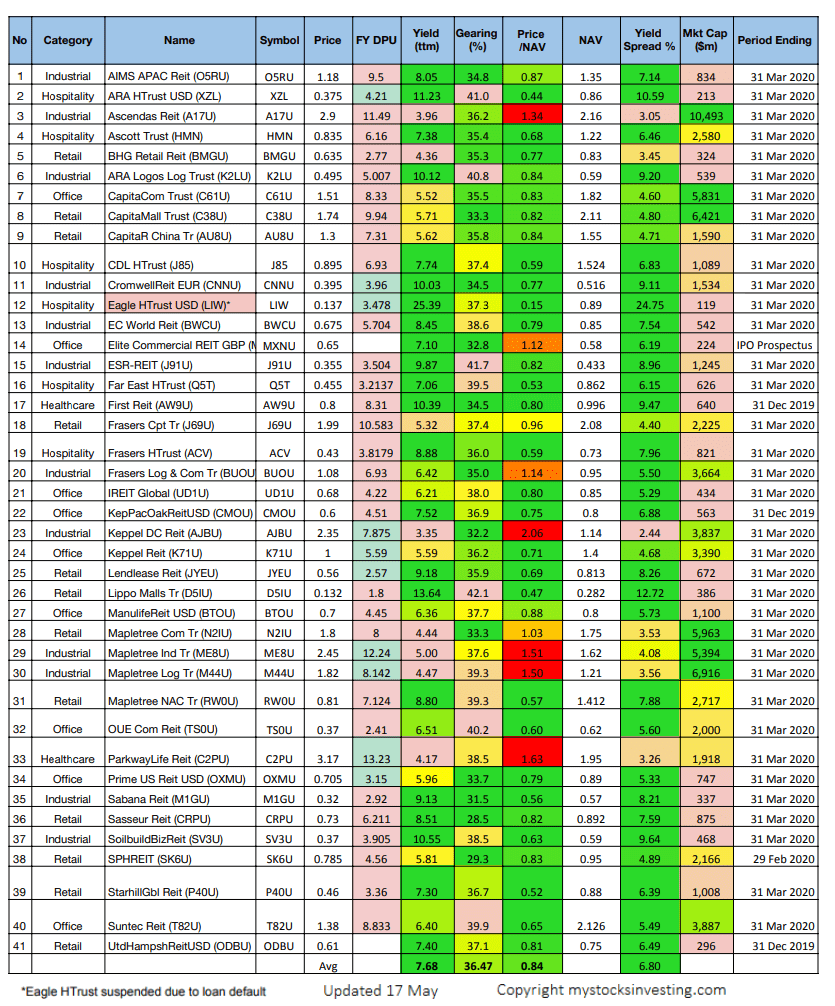
The following is the compilation of 41 REITs in Singapore with colour coding of the Distribution Yield, Gearing Ratio and Price to NAV Ratio. This gives investors a quick glance of which REITs are attractive enough to have an in-depth analysis. DPU Yield for Elite Commercial REIT, United Hampshire REIT are projections based on the IPO prospectus.
- Note 1: The Financial Ratio are based on past data and there are lagging indicators.
- Note 2: This REIT table takes into account the dividend cuts due to COVID-19 outbreak. Yield is calculated trailing twelve months (ttm), therefore REITs with delayed payouts might have lower displayed yields. Yield displayed also takes into account Q2 2020 results (where earnings have not been declared for most REITs), thus yield displayed might be lower.
- Noted 3: Distribution Yield, NAV, Gearing Ratio would probably be adjusted moving forward.
- Note 4: Historical Price/NAV High and Low information is available here.
- Note 5: Additional financial ratio such as WALE, WADM, All in Interest Cost, Interest Coverage Ratio, Unsecured Loan %, Fixed Interest %, Geographical location of the properties, etc have been compiled and updated monthly in Kenny’s Enhance REIT table.
- Note 6: Some REITs opted for semi-annual reporting.
- Note 7: MAS has raised the Gearing Limit from 45% to 50% on April 16. The implementation of Interest Coverage Ratio (ICR) > 2.5x has been deferred to Jan 1, 2022. See the announcement Higher Leverage Limit and Deferral of Interest Coverage Requirement by MAS.
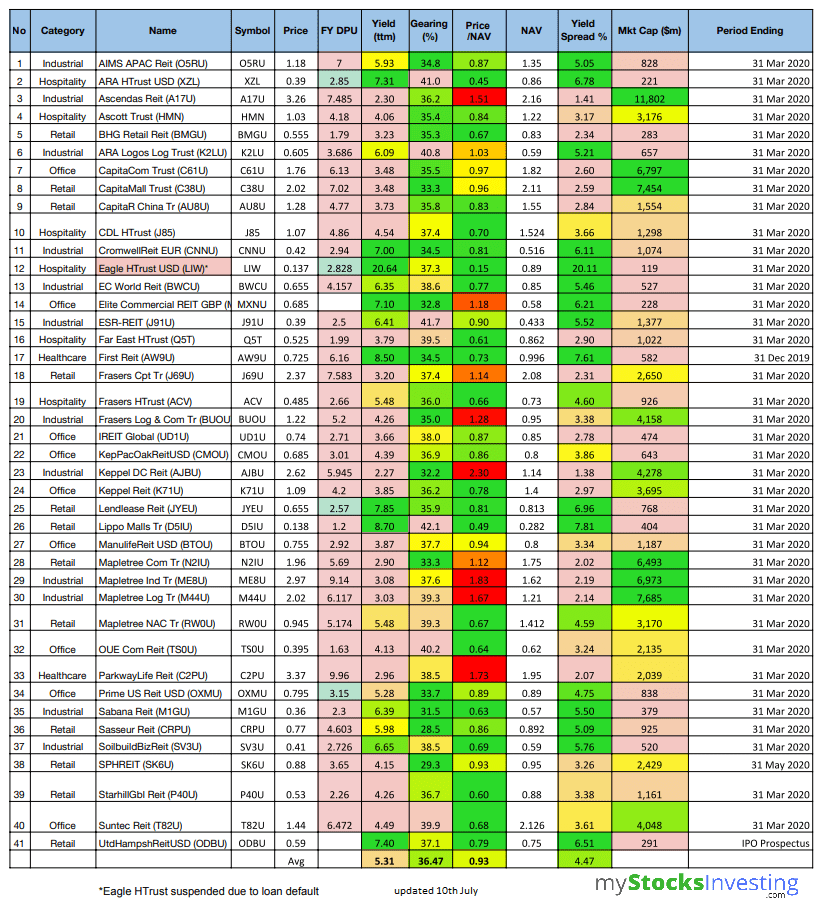
- Price/NAV increased from 0.92 to 0.93 (Singapore Overall REIT sector is undervalued now).
- Distribution Yield decreased from 6.45% to 5.31% (take note that this is lagging number). About 17% of Singapore REITs (7 out of 41) have Distribution Yield > 7%. Do note that these yield numbers are based on current prices taking into account delayed distribution/dividend cuts due to COVID-19.
- Gearing Ratio maintains at 36.47%. In general, Singapore REITs sector gearing ratio is healthy. Note: Gearing may be affected (ie. potential increase) as the valuation of the portfolio would be reduced.
- The most overvalued REITs are Keppel DC REIT (Price/NAV = 2.30), followed by Mapletree Industrial Trust (Price/NAV = 1.83), Parkway Life (Price/NAV = 1.73), Mapletree Logistic Trust (Price/NAV = 1.67) and Ascendas REIT (Price/NAV = 1.51).
- The most undervalued REITs (based on NAV) are Eagle Hospitality Trust* (Price/NAV =0.15), followed by ARA Hospitality Trust (Price/NAV = 0.45), Lippo Malls Indonesia Retail Trust (Price/NAV = 0.49), Far East HT (Price/NAV = 0.61) and Starhill Global (Price/NAV = 0.60)
- The Highest Distribution Yield (TTM) is Lippo Malls Indonesia Retail Trust (8.70%), First REIT (8.50%), ARA Hospitality Trust (7.31%), Lendlease REIT (7.85%) and Cromwell REIT (7.00%). Reminder that these yield numbers are based on current prices taking into account delayed distribution/dividend cuts due to COVID-19. Some REITs opted for semi annual reporting and thus no quarterly DPU was announced.
- The Highest Gearing Ratio REITs are Lippo Malls Trust (42.1%), ESR REIT (41.7%), ARA Hospitality Trust (41.0%) and ARA Logos Log Trust (40.8%) (previously Cache Log Trust) and OUE Commercial REIT (40.2%)
- Top 5 REITs with biggest market capitalisation are Ascendas REIT ($11.8B), Mapletree Logistics Trust ($7.7B), CapitaMall Trust ($7.4B), Mapletree Commercial Trust ($6.5B) and Capitaland Commercial Trust ($6.8B)
- The bottom 3 REITs with smallest market capitalisation are Eagle Hospitality Trust ($119M), ARA Hospitality Trust ($221M) and Elite Commercial REIT ($228M)
- *Eagle Hospitality Trust is currently suspended
Disclaimer: The above table is best used for “screening and shortlisting only”. It is NOT for investing (Buy / Sell) decision. To learn how to use the table and make investing decision, Sign up next REIT Investing Workshop here to learn how to choose a fundamentally strong REIT for long term investing for passive income generation.
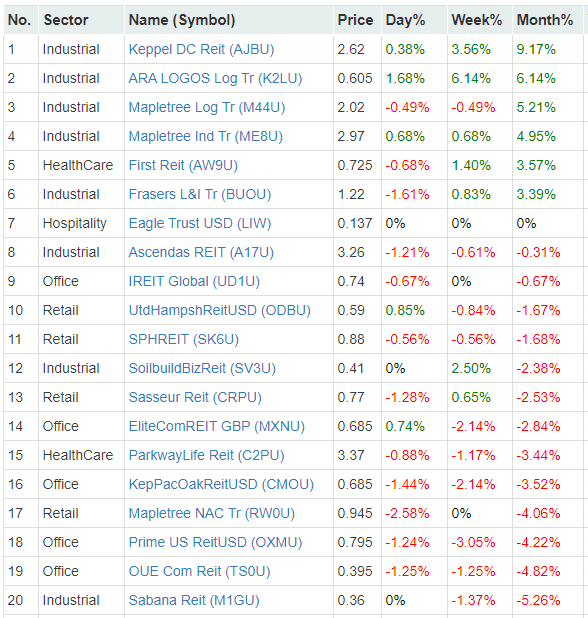
Top 20 Performance of the Month (Source: https://stocks.cafe/kenny/free)
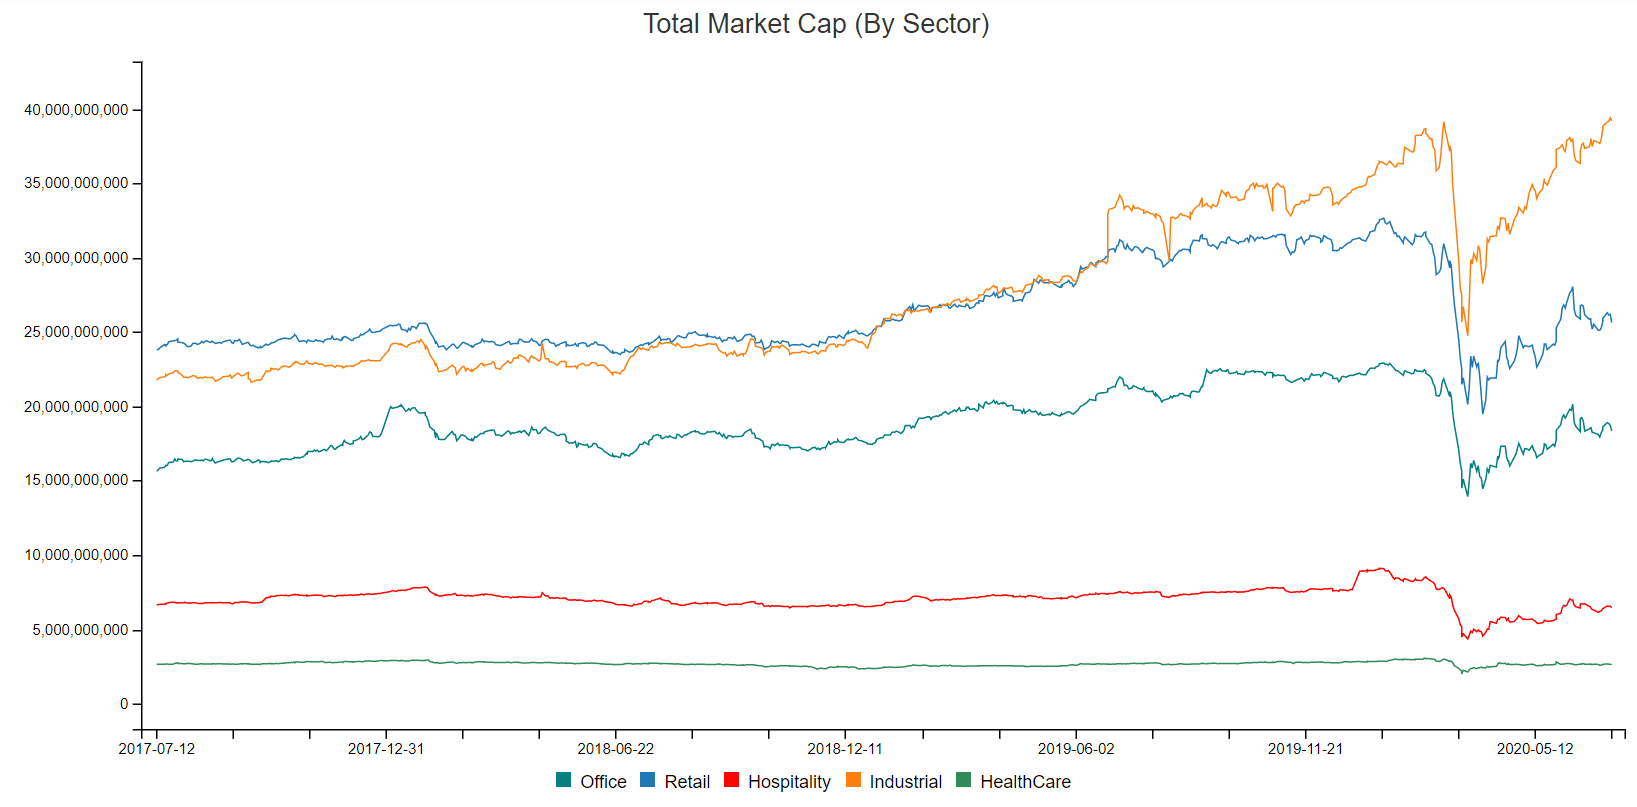
REIT Sectors Performance (Source: https://stocks.cafe/kenny/overview)
Singapore SIBOR Rate Watch
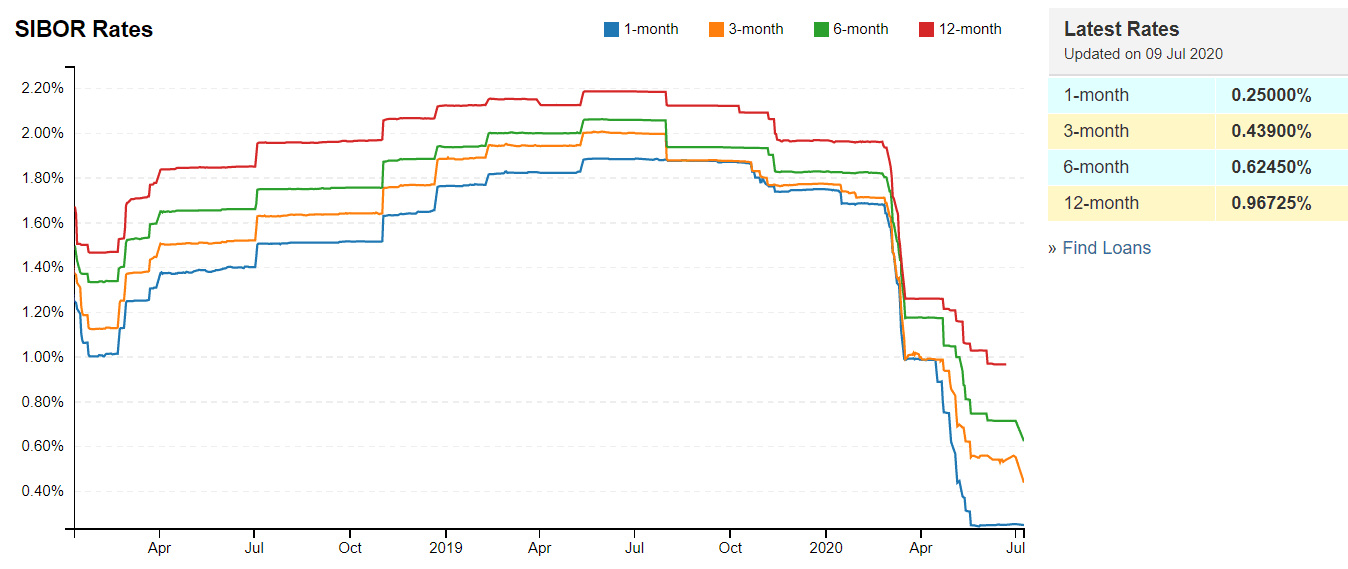
- 1 month increases from 0.24925% to 0.25000%
- 3 month decreases from 0.54516% to 0.43900%
- 6 month decreases from 0.71788% to 0.62450%
- 12 month decreases from 1.03013% to 0.96725%
Summary
Fundamentally the whole Singapore REITs is undervalued now based on simple average on the Price/NAV. The big cap REITs rebounded quickly after the huge REIT crash. Valuation for some big cap REITs are stretch now and some of them are back to pre-COVID19 market crash level. Retail & Hospitality sectors, small & medium cap REITs are very attractive based on the NAV. However, do take note that NAV would probably be adjusted downward caused by the devaluation of property value. We have already seen the NAV of some REITs are adjusted downward and the increase of gearing ratio, from the latest earning release or business update.
Yield spread (reference to 10 year Singapore government bond of 0.896%) has tightened from 5.47% to 4.414% due to cut in dividend yield. The risk premium are still attractive to accumulate Singapore REITs in stages to lock in the current price and long term yield after the recovery.
Technically the REIT Index is currently trading on sideway consolidation until the breakout either break above the 200D SMA or break below the 50D SMA.
Note: This above analysis is for my own personal research and it is NOT a buy or sell recommendation. Investors who would like to leverage on my extensive research and years on REIT investing experience can approach me separately for REIT Portfolio Consultation.
See other relevant posts here:
- Singapore REITs Bubble Charts
- 3 Singapore REITS which have completed V Shape Recovery.
- Money and Me: V for S-REITs?
- Money and Me: Will revenge spending help REITs?
- Money and Me: What REITs to Look out for?
- Money and Me: Crazy REIT Sales
- COVID19 Crash: Risk or Opportunity to hold REITs?
- Singapore REITs Black Monday Crash
My Next REIT Online Course is planned on July 18, 2020 (Saturday). Do take note that I only conduct REIT course for retail investors once a quarter as I am busying conducting training for Singapore Exchange (SGX) and Institute Banking and Finance (IBF) Singapore in addition to my financial advisory works. You can find the registration detail here. https://mystocksinvesting.com/course/singapore-reits-investing/
2020-07-14 (Tue) Webinar: REITs Outlook in COVID-19 Phase 2 and Beyond – What are the Risks and Where are the Opportunities – Kenny Loh – Register ASAP as Slots are Limited!