Singapore REIT Fundamental Analysis Comparison Table – 9 October 2016

  • Post author:

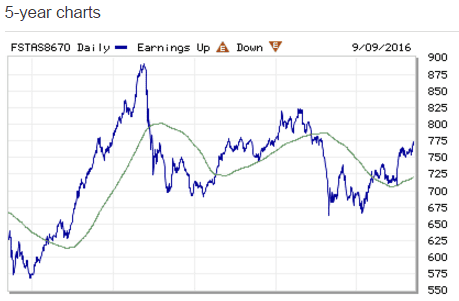
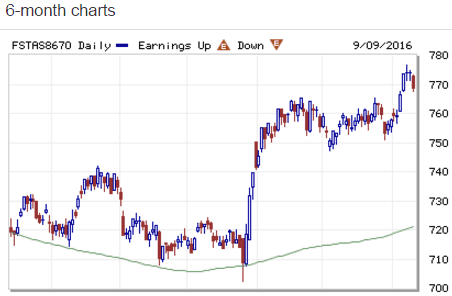
FTSE ST Real Estate Investment Trusts (FTSE ST REIT Index) decreases from 768.70 to 764.77 (-0.51%) compare to last post on Singapore REIT Fundamental Comparison Table on Sept 12, 2016. The index is rejected at the declining trend line resistance and currently may be forming a right shoulders of a complicated Head and shoulders reversal pattern (i.e. 2 left shoulders).  Base on chart pattern, upside is limited although the index is still in bullish territory. SGX S-REIT (REIT.SI) Index increases from 1183.53 to 1176.60 (-0.59%).

ftse-st-reit-index-5y-oct9-2016ftse-st-reit-index-6m-oct9-2016


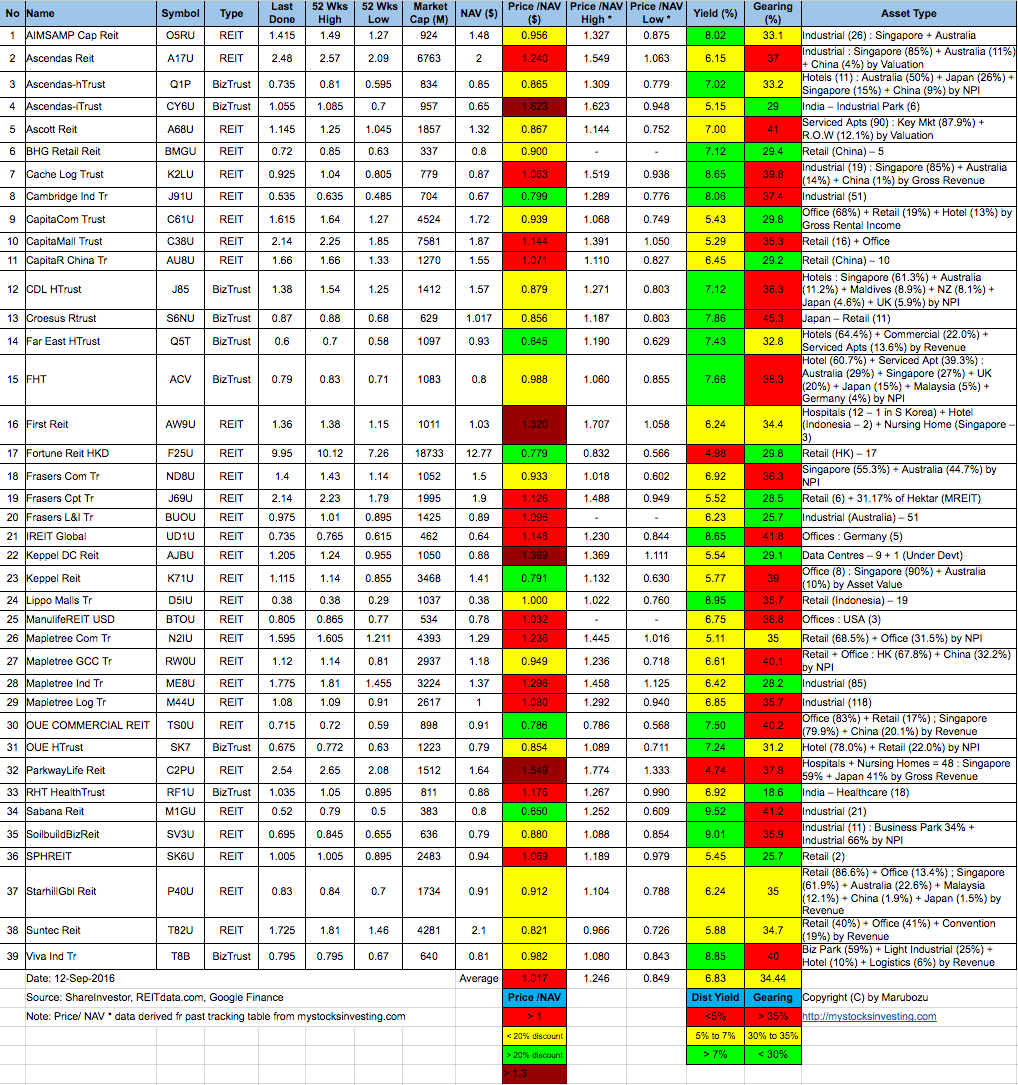
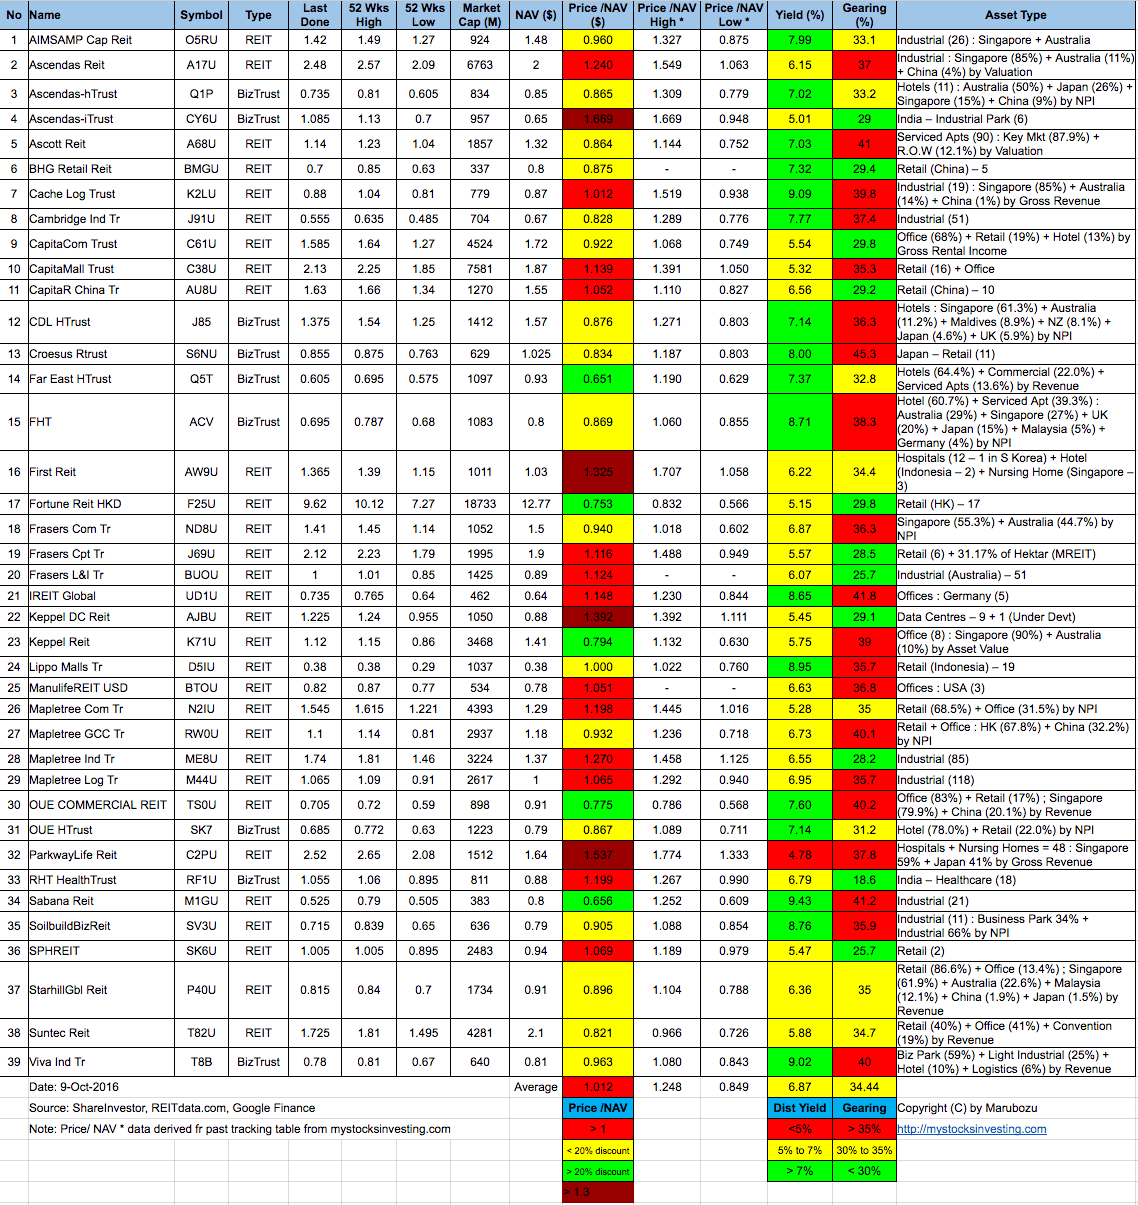
  • Price/NAV decreases from  1.017  to 1.012 (Singapore Overall REIT sector is slightly over value now)
  • Distribution Yield increases from 6.83% to 6.87% (take note that this is lagging number). Less than half of Singapore REITs (17 out of 39) have Distribution Yield > 7%. High yield REITs mainly from Hospitality Trust and small cap Industrial REIT. Selection of Singapore REITs have become much more important now because not all the high yield REITs has strong fundamental.
  • Gearing Ratio remains at 34.44%.  20 out of 39 have Gearing Ratio more than 35%.
  • Most overvalue is Ascendas iTrust (Price/NAV = 1.669), followed by Parkway Life (Price/NAV = 1.537) and Keppel DC REIT (Price/NAV = 1.392)
  • Most undervalue (base on NAV) is Far East HTrust (Price/NAV = 0.651), followed by Sabana REIT (Price/NAV = 0.656) and Fortune REIT (Price/NAV = 0.753).
  • Highest Distribution Yield is Sabana REIT (9.43%), followed by Cache Logistic Trust (9.09%) and Viva Industrial Trust (9.02%)
  • Highest Gearing Ratio is Croesus Retail Trust (45.3%), iREIT Global (41.8%) and Sabana REIT (41.2%)

singapore-reit-fundamental-analysis-and-comparison-table-9-oct-2016


Disclaimer: The above table is best used for “screening and shortlisting only”. It is NOT for investing (Buy / Sell) decision. To learn how to use the table and make investing decision, Sign up next REIT Investing Seminar here to learn how to choose a fundamentally strong REIT for long term investing for passive income generation.

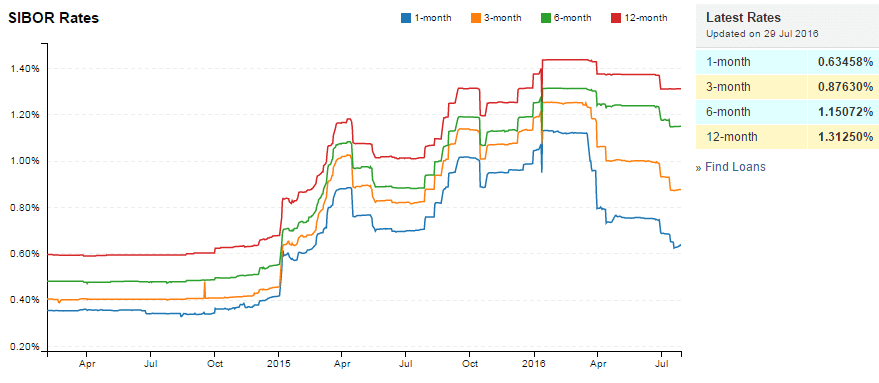
  • Singapore Interest Rate remains at 0.38%.

singapore-interest-rate-oct9-2016sibor-oct9-2016

  • 1 month remains at 0.62233%
  • 3 month increases from 0.87192% to 0.87242%
  • 6 month decreases from 1.15071% to 1.14421%
  • 12 month remains at 1.31183%

singapore-manufacturing-pmi-oct9-2016


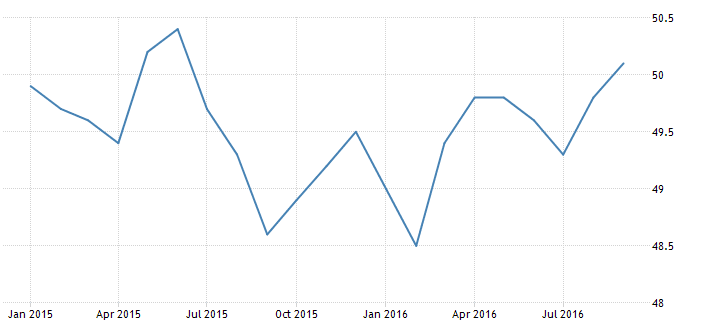
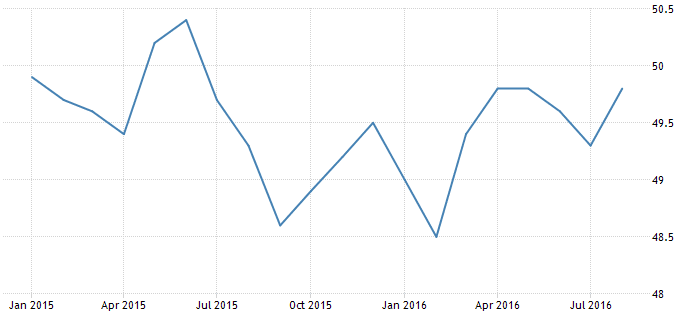
The Singapore Manufacturing PMI increased to 50.1 in September of 2016 from 49.8 in the previous month. The reading pointed to the expansion in the factory activity for the first time in 15 months, led by higher new orders, new exports, and output. Also, the electronics sector rose to 50.3 from 50.2 in August. Manufacturing PMI in Singapore averaged 50.03 from 2012 until 2016, reaching an all time high of 51.90 in October of 2014 and a record low of 48.30 in October of 2012. Manufacturing PMI in Singapore is reported by the Singapore Institute of Purchasing & Materials Management, SIPMM.


Singapore REITs in general is slightly over value now. Distribution yield for some Singapore REITs with bigger market capitalization is not very attractive. However, there are still opportunities in Singapore REITs with smaller market capitalization. Opportunities present in Hospitality sector as the valuation and yield is attractive but future DPU growth does not have good visibility.

Technically Singapore REITs sector is in bullish territory and on uptrend but facing immediate declining trend line resistance. Unlikely to see further upside in Singapore REIT sector due to the imminent potential interest hike end of the year after US Presidential Election.

Finally there is a REIT ETF launched in Singapore – PHILLIP SGX APAC DIVIDEND LEADERS REIT ETF. Check out Prospectus and Product Highlight Sheet here.

Original post from https://mystocksinvesting.com

Check out coming seminars at https://mystocksinvesting.com/events


Continue ReadingSingapore REIT Fundamental Analysis Comparison Table – 9 October 2016

Singapore REIT Fundamental Analysis Comparison Table – 12 September 2016

  • Post author:

FTSE ST Real Estate Investment Trusts (FTSE ST REIT Index) increases from 756.17 to 768.70 (+1.66%) compare to last post on Singapore REIT Fundamental Comparison Table on August 8, 2016. The index is rejected at the declining trend line resistance with an Evening Doji Star reversal pattern. Base on chart pattern, upside is limited although the index is still in bullish territory. SGX S-REIT (REIT.SI) Index increases from 1162.02  to 1183.53 (+1.85%)

ftse-st-reit-index-5y-sept-12-2016ftse-st-reit-index-6m-sept-12-2016

  • Price/NAV increases from  1.003 to 1.017 (Singapore Overall REIT sector is slightly over value now)
  • Distribution Yield decreases from 6.96% to 6.83% (take note that this is lagging number). Less than half of Singapore REITs (16 out of 39) have Distribution Yield > 7%. Not all the REITs have attractive yield now. A number of REITs like Capita Comm Trust, Capitaland Mall Trust, Frasers Centrepoint Trust, Keppel DC REIT, Mapletree Comm Trust, SPH REIT have less than 6% distribution yield. Selection of Singapore REITs have become much more important now because not all the high yield REIT has strong fundamental.
  • Gearing Ratio decreases from 34.50% to 34.44%.  20 out of 39 have Gearing Ratio more than 35%.
  • Most overvalue is Ascendas iTrust (Price/NAV = 1.623), followed by Parkway Life (Price/NAV = 1.549) and Keppel DC REIT (Price/NAV = 1.369)
  • Most undervalue (base on NAV) is Far East HTrust (Price/NAV = 0.645), followed by Sabana REIT (Price/NAV = 0.65) and Fortune REIT (Price/NAV = 0.779).
  • Highest Distribution Yield is Sabana REIT (9.52%), followed by Soilbuild Biz REIT (9.01%) and Lippo Malls Indonesia Retail Trust (8.95%)
  • Highest Gearing Ratio is Croesus Retail Trust (45.3%), iREIT Global (41.8%) and Sabana REIT (41.2%)

singapore-reit-fundamental-analysis-and-comparison-table-12-sep-2016

Disclaimer: The above table is best used for “screening and shortlisting only”. It is NOT for investing (Buy / Sell) decision. To learn how to use the table and make investing decision, Sign up next REIT Investing Seminar here to learn how to choose a fundamentally strong REIT for long term investing for passive income generation.

  • Singapore Interest Rate increases from 0.37% to 0.38%.

singapore-interest-rate-sept12-2016 sibor-sept-12-2016

  • 1 month decreases 0.63458% to 0.62233%
  • 3 month decreases from 0.87630% to 0.87192%
  • 6 month decreases from 1.15072% to 1.15071%
  • 12 month decreases from 1.31250% to 1.31183%

singapore-manufacturing-pmi-sept12-2016

The Singapore PMI increased to 49.8 in August of 2016 from 49.3 in the previous month. Although the reading pointed to the fourteenth consecutive month of contraction, new orders, new export orders, production and employment declined at a slower pace. Also, electronics sector expanded for the first time in 14 months (50.2 from 49.7 in July). Manufacturing PMI in Singapore averaged 50.13 from 2012 until 2015, reaching an all time high of 51.90 in October of 2014 and a record low of 48.30 in October of 2012. Manufacturing PMI in Singapore is reported by the Singapore Institute of Purchasing & Materials Management, SIPMM.


Singapore REITs in general is slightly over value now. Distribution yield for some Singapore REITs with bigger market capitalization is not very attractive. However, there are still opportunities in Singapore REITs with smaller market capitalization. The high distribution yield of these REITs are caused by huge drop in share price due to weak fundamental instead of strong DPU growth.  Technically Singapore REITs sector is in bullish territory and on uptrend but facing immediate declining trend line resistance. US Fed is now starting to talk about the interest rate hike which may put pressure on Singapore REITs moving forward.  Nevertheless, not all the REIT are affected by the rate hike due to the different debt profile. This may present an opportunity to pick up some fundamentally strong Singapore REITs if there is a knee jerk sell off in the Singapore REITs sector. Come and learn how to spot these gems and identify how to time an good entry in the coming Singapore REIT Investing course.


Original post from https://mystocksinvesting.com


Continue ReadingSingapore REIT Fundamental Analysis Comparison Table – 12 September 2016

Singapore REIT Fundamental Analysis Comparison Table – 8 August 2016

  • Post author:

FTSE ST Real Estate Investment Trusts (FTSE ST REIT Index) increases from 745.33 to 756.17 (+1.45%) compare to last post on Singapore REIT Fundamental Comparison Table on July 3, 2016. The index broke out from Rectangle consolidation chart pattern and is currently forming a “Higher High, Higher Low” uptrend chart pattern. 200D SMA also starts to trend upward. This is the bullish sign and technically Singapore REIT sector is in bullish territory. SGX S-REIT (REIT.SI) Index increases from 1141.99 to 1162.02 (+1.05%)

FTSE ST REIT Index Aug7-2016

  • Price/NAV increases from  0.97 to 1.003 (Singapore Overall REIT sector at FAIR value now)
  • Distribution Yield decreases from 7.14% to 6.96% (take note that this is lagging number). More than half of Singapore REITs (19 out of 39) have Distribution Yield > 7%. Current yield is attractive (for certain REITs only) but it is dangerous to make investing decision purely base on the yield. Past performance does NOT equal to future performance.
  • Gearing Ratio decreases from 34.53% to 34.50%.  20 out of 39 have Gearing Ratio more than 35%.
  • Most overvalue is Ascendas iTrust (Price/NAV = 1.585), followed by Parkway Life (Price/NAV = 1.524).
  • Most undervalue (base on NAV) is Sabana REIT (Price/NAV = 0.65), followed by Far East HTrust (Price/NAV = 0.656) and Keppel REIT (Price/NAV = 0.752).
  • Higher Distribution Yield is Sabana REIT (9.52%), followed by VIVA Industrial Trust (9.51%) followed by Soilbuild Biz REIT (9.27%)
  • Highest Gearing Ratio is Croesus Retail Trust (46.2%), iREIT Global(43.1%) and OUE Commercial Trust (40.2%)

Singapore-REIT-Fundamental-Analysis-and-Comparison-Table-7-Aug-2016


Disclaimer: The above table is best used for “screening and shortlisting only”. It is NOT for investing (Buy / Sell) decision. To learn how to use the table and make investing decision, Sign up next REIT Investing Seminar here to learn how to choose a fundamentally strong REIT for long term investing for passive income generation.

  • Singapore Interest Rate increases from 0.23% to 0.37%

Singapore Interest Rate Aug7-2016 SIBOR Aug7-2016

  • 1 month decreases 0.75000% to 0.63458%
  • 3 month decreases from 0.99463% to 0.87630%
  • 6 month decreases from 1.23466% to 1.15072%
  • 12 month decreases from 1.37375% to 1.31250%

Singapore Manufacturing PMI Aug7-2016

The Singapore PMI decreased to 49.3 in July of 2016 from 49.6 in the previous month, as sluggish global demand continued to weigh on the economic performance. The reading pointed to the thirteenth consecutive month of contraction, as new orders fell further to 49.0 (from 49.2 in June), new exports orders declined to 48.8 (from 48.9 in June) and output went down to 49.3 (from 49.4 in June). Manufacturing PMI in Singapore averaged 50.13 from 2012 until 2015, reaching an all time high of 51.90 in October of 2014 and a record low of 48.30 in October of 2012. Manufacturing PMI in Singapore is reported by the Singapore Institute of Purchasing & Materials Management, SIPMM.


Fundamentally Singapore REITs in general, the valuation is at Fair Value but distribution yields are still attractive. Technically Singapore REITs sector is in bullish territory and on uptrend. US Fed may delay the interest rate hike as there are a lot of uncertainties due to Brexit.  This may probably be the reason why Singapore REIT is coming back to life again!  Come and Learn How to Find Good Value Singapore REIT steps by steps to Invest at Singapore REITs Investing class.


Original post from https://mystocksinvesting.com


Continue ReadingSingapore REIT Fundamental Analysis Comparison Table – 8 August 2016