Singapore REIT Fundamental Analysis Comparison Table – 1 April 2018
Technical Analysis
FTSE ST Real Estate Investment Trusts (FTSE ST REIT Index) increases slightly from 811.22 to 818.49 (+0.9%) as compared to last post on Singapore REIT Fundamental Comparison Table on Mar 4, 2018. The REIT index is trading in a Bear Flag pattern below the 200D SMA. The index up trend is definitely over and looks like going to reverse to down trend after breaking the 200D SMA support. Breaking down this Bear Flag will send the REIT index down to target zone of 760-770. The 50D SMA is crossing down 150D SMA and getting close to cross down 200D SMA. These are all bearish signals which may launch the REIT index to full down trend unless the REIT index break the Flag resistance to invalid this bearish chart pattern.

Fundamental Analysis

- Price/NAV increases from 1.05 to 1.06 (Singapore Overall REIT sector is still over value now after the recent sell off).
- Distribution Yield maintains at 6.47% (take note that this is lagging number). About one third of Singapore REITs (11 out of 39) have Distribution Yield > 7%.
- Gearing Ratio maintains at 34.8%. 20 out of 37 have Gearing Ratio more than 35%. In general, Singapore REITs sector gearing ratio is healthy.
- Most overvalue REIT is Parkway Life (Price/NAV = 1.62), followed by Keppel DC REIT (Price/NAV = 1.55), First REIT (Price/NAV = 1.36) and Mapletree Industrial Trust (Price/NAV = 1.43).
- Most undervalue (base on NAV) is Fortune REIT (Price/NAV = 0.69), followed by OUE Comm REIT (Price/NAV = 0.77) and Sabana REIT (Price/NAV = 0.79).
- Highest Distribution Yield (TTM) is Lippo Mall Indonesia Retail Trust (8.94%), followed by SoilBuild BizREIT (8.79%), Viva Industrial Trust (8.45%), EC World REIT (8.14%), and Cache Logistic Trust (8.07%).
- Highest Gearing Ratio are Soilbuild BizREIT (40.6%) and iREIT Global (40.3%).
Disclaimer: The above table is best used for “screening and shortlisting only”. It is NOT for investing (Buy / Sell) decision. To learn how to use the table and make investing decision, Sign up next REIT Investing Seminar here to learn how to choose a fundamentally strong REIT for long term investing for passive income generation.
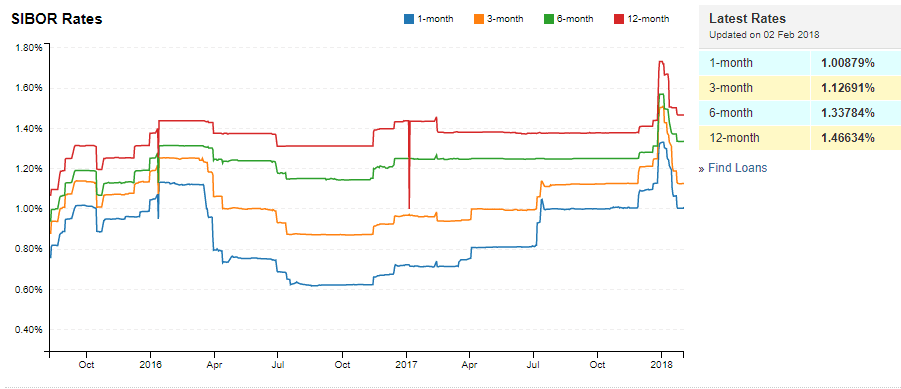
Interest Rate

- 1 month increases from 1.12625% to 1.25250%
- 3 month increases from 1.24563% to 1.37733%
- 6 month increases from 1.39888% to 1.53101%
- 12 month increases from 1.52796% to 1.70876%
Summary
Fundamentally the whole Singapore REITs is still over value now after the sell off in February. There was no knee jerk reaction to REIT index after the US Fed hikes the 25 bps to 1.75% as this is within the expectation. Overall yield for Singapore REIT is still attractive (average yield of 6.47%). However, technically, the REIT index is consolidating in a Bear Flag chart pattern. The index may have another big move down if the support of the Bear Flag is broken. Technically the direction of the REIT index is short term side way and medium term down trend.
What Should You Do?
- If you are holding any big REIT position, you may want to reduce your exposure or hedge your portfolio. You have to proactively manage (making decision logically) your portfolio instead of reacting to the event (emotion takes over) when things happen. Be prepared for another huge leg down if the technical support is broken.
- If you do not have any REIT now but want to build up your REIT portfolio for passive income, it is time to do homework now to put fundamental strong REIT into your watch list. You can do a great shopping when there is panic selling.
- I receive many emails asking me when is my next REIT class. The tentative date is on June 16 & 17 but I will still working on the logistic and registration detail. I would suggest you subscribe through my mailing list to be kept posted on the next REIT class schedule. https://mystocksinvesting.com/course/singapore-reits-investing/
- If you need an independent professional review on your current REIT portfolio and need any recommendation, you may engage me in the REIT portfolio Advisory. REITs Portfolio Advisory. https://mystocksinvesting.com/course/private-portfolio-review/
See all other relevant Singapore REITs blog posts here.