Singapore REIT Fundamental Analysis Comparison Table – 2 January 2017
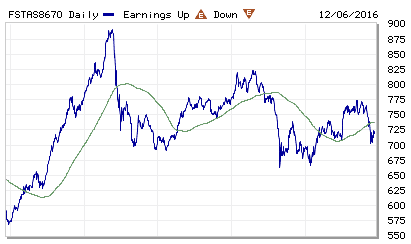
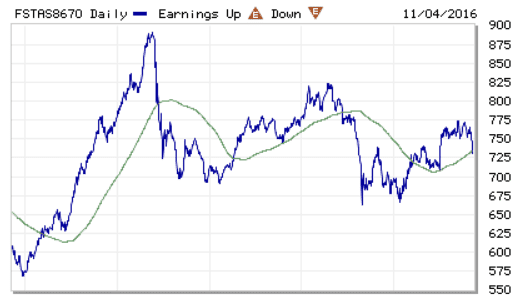
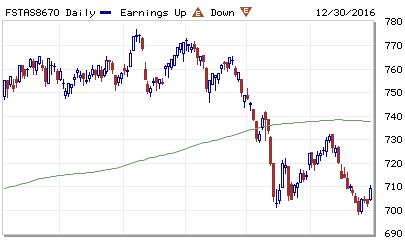
FTSE ST Real Estate Investment Trusts (FTSE ST REIT Index) decreases from 722.05 to 709.49 (-1.74%) compare to last post on Singapore REIT Fundamental Comparison Table on Dec 5, 2016. The index is trading below the 200D SMA. Take note that the 200D SMA is no longer sloping up and is currently flat. If the index continues to trade below 200D SMA and the 200D starts to slope down, the Singapore REIT sector will reverse to a confirmed down trend. FTSE ST Real Estate Investment Trust Index is currently forming a Falling Wedge and is finding a short term support at about 700. Keep an eye to see whether this support holds in the next few months. SGX S-REIT (REIT.SI) Index decreases from 1111.15 to 1092.36 (-1.69%).

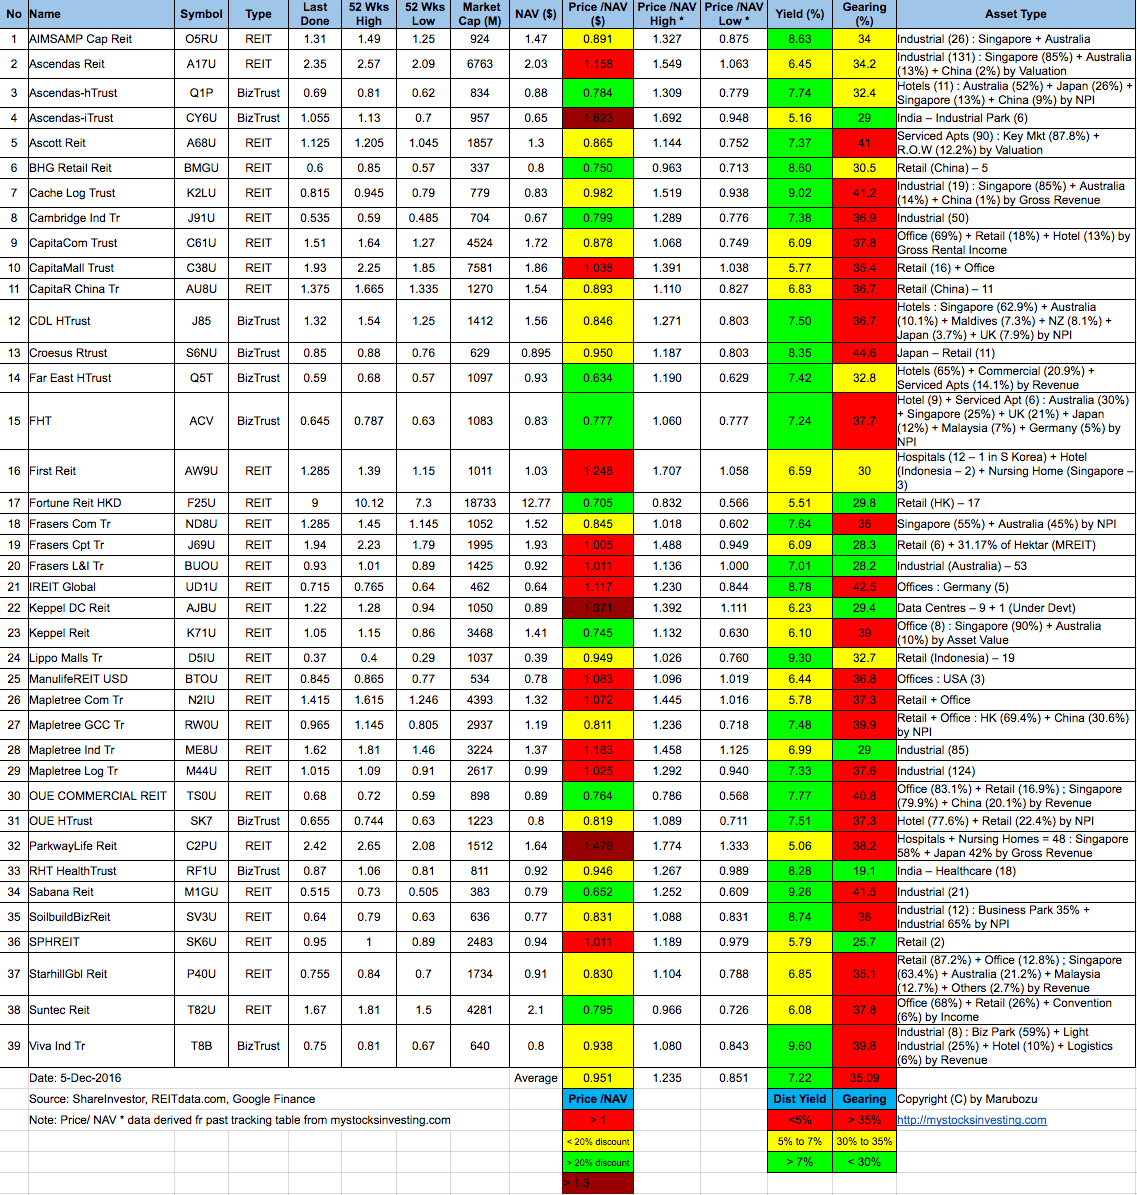
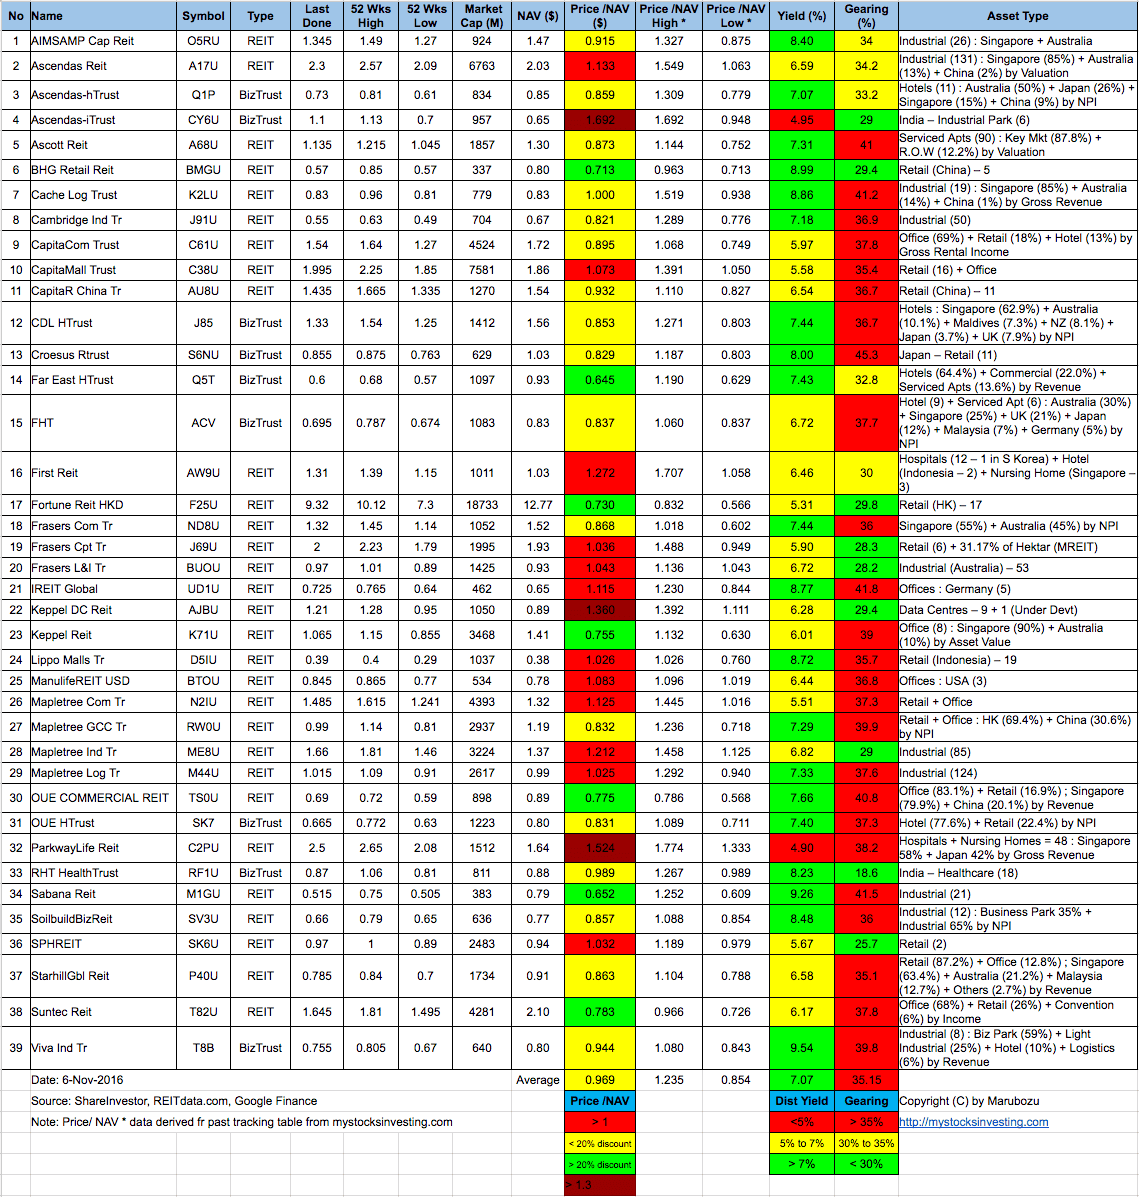
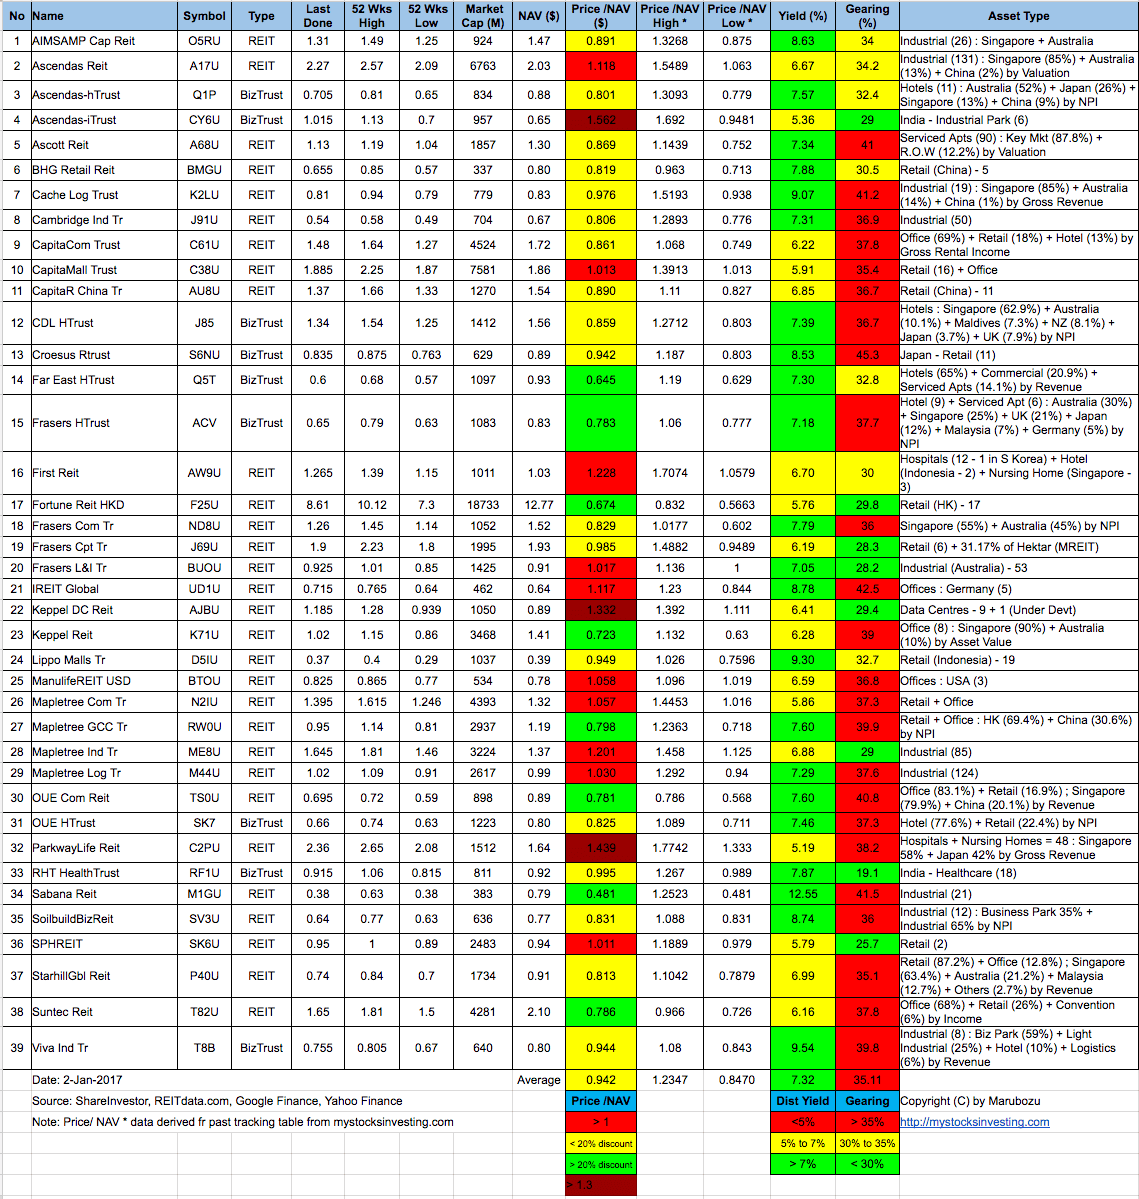
- Price/NAV decreases from 0.951 to 0.942 (Singapore Overall REIT sector is under value now) after recent sell off. Current Price/NAV is getting closer to Feb 2015 low of 0.91. See Singapore REIT Table Feb-2016 here.
- Distribution Yield increases from 7.22% to 7.32% (take note that this is lagging number). More than half of Singapore REITs (22 out of 39) have Distribution Yield > 7%. High yield REITs mainly from Hospitality Trust and small cap Industrial REIT. However, some of the big cap & fundamentally strong REITs become attractive again. How to spot those Fundamentally strong REIT with attractive yield to build up a Passive Income Portfolio?
- Gearing Ratio increases from 35.09% to 35.11%. 24 out of 39 have Gearing Ratio more than 35%.
- Most overvalue is Ascendas iTrust (Price/NAV = 1.562), followed by Parkway Life (Price/NAV = 1.439) and Keppel DC REIT (Price/NAV = 1.332)
- Most undervalue (base on NAV) is Sabana REIT (Price/NAV = 0.481), followed by Far East HTrust (Price/NAV = 0.645) and Fortune REIT (Price/NAV = 0.674).
- Highest Distribution Yield is Sabana REIT (12.55%), followed by Viva Industrial Trust (9.54%) and Lippo Malls Indonesia Retail Trust (9.30%).
- Highest Gearing Ratio is Croesus Retail Trust (45.3%), iREIT Global (42.5%), Sabana REIT (41.5%), Cache Logistic Trust (41.2%), Ascott REIT (41.0%) and OUE Commercial REIT (40.8%)
Disclaimer: The above table is best used for “screening and shortlisting only”. It is NOT for investing (Buy / Sell) decision. To learn how to use the table and make investing decision, Sign up next REIT Investing Seminar here to learn how to choose a fundamentally strong REIT for long term investing for passive income generation.
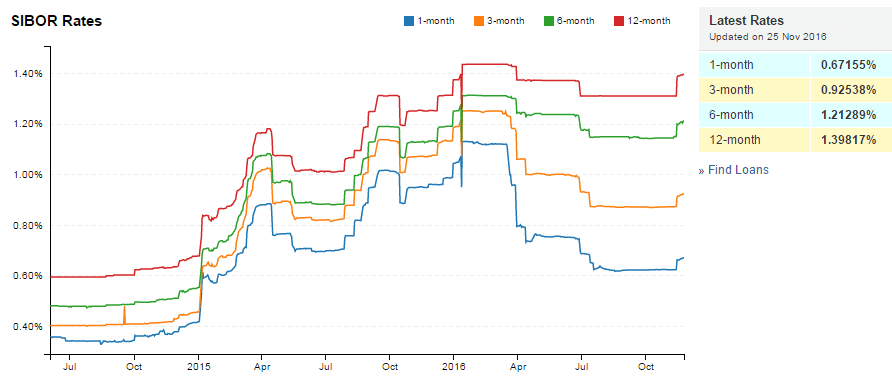
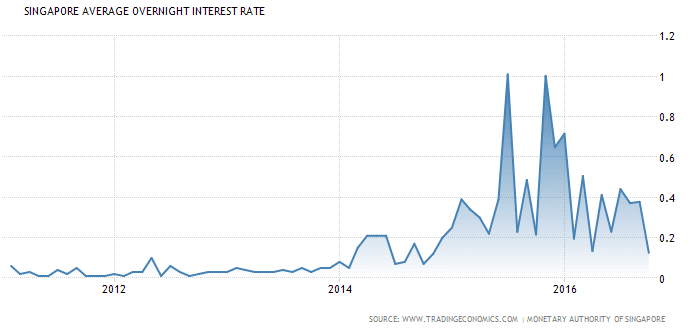
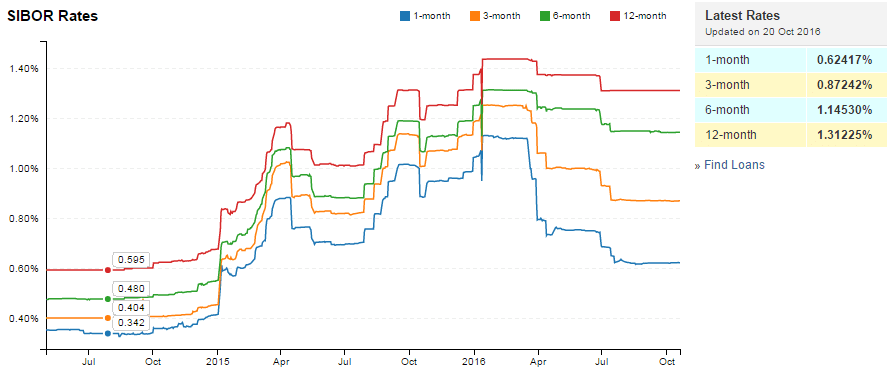
- Singapore Interest Rate decreases from 0.07% to 0.06%.
- Take note of the past historical interest rate and how high the rate can go. This is an important factor to keep a close eye for Singapore REIT investing because REIT leverages on debt to generate DPU. Current Singapore interest rate is abnormally low and will not stay low forever.

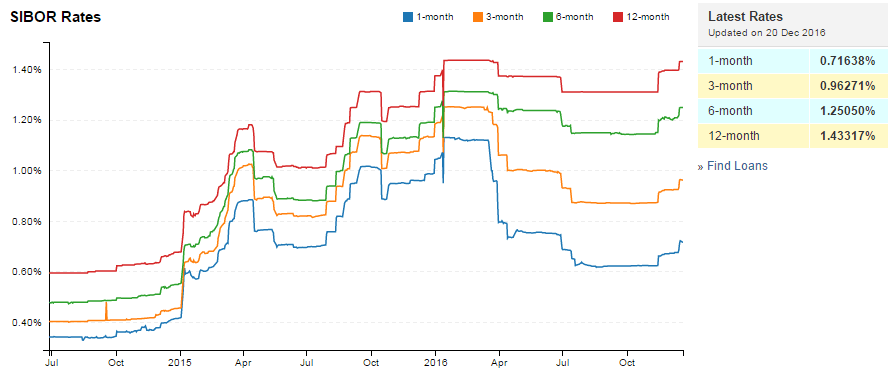
- 1 month increases from 0.67155% to 0.71638%
- 3 month increases from 0.92538% to 0.96271%
- 6 month increases from 1.21289% to 1.25050%
- 12 month increases from 1.39817% to 1.43317%

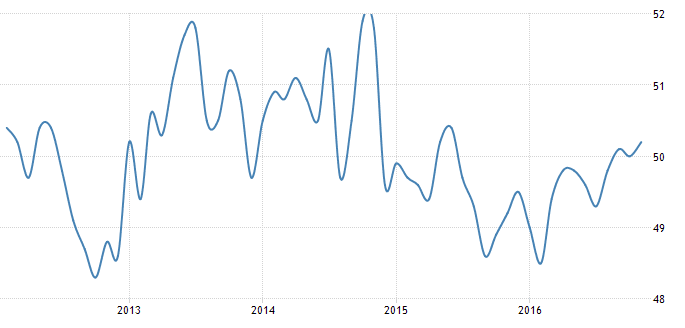
Manufacturing PMI in Singapore increased to 50.20 in November from 50 in October of 2016. Manufacturing PMI in Singapore averaged 50.03 from 2012 until 2016, reaching an all time high of 51.90 in October of 2014 and a record low of 48.30 in October of 2012.

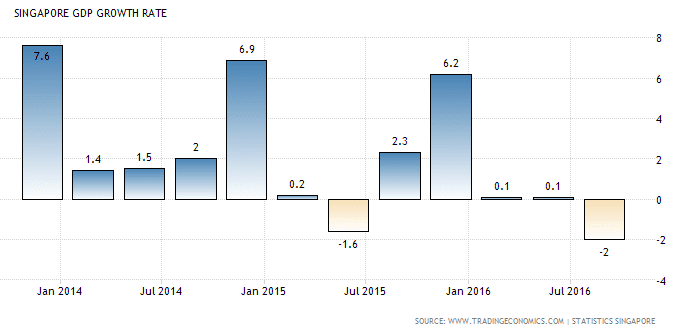
The Singaporean economy contracted a seasonally-adjusted annualized 2 percent on quarter in the three months to September of 2016, compared to a 4.1 percent decline in preliminary estimates. Markets were expecting a 2.5 percent contraction. GDP Growth Rate in Singapore averaged 6.82 percent from 1975 until 2016, reaching an all time high of 37.20 percent in the first quarter of 2010 and a record low of -13.50 percent in the fourth quarter of 2008.
Singapore REITs sector continued the selling off after US Fed rate hike. Technically FTSE ST REIT index is bearish and is on down trend. Another round of sell off is expected if the index breaks the 700 support level. Current valuation base on Price/NAV and Distribution yield become attractive again. As long as the index finds a good support at 700, there are good opportunities to pick up some fundamental strong REIT. Two questions may interest all the retail investors: WHEN is the right and safe time and WHAT REIT to pick? Check out the next Investing in Singapore REIT course here.
See my Singapore REIT 2017 Market Outlook here.
Original post from https://mystocksinvesting.com
Check out coming seminars at https://mystocksinvesting.com/events