
Singapore REIT Monthly Update (August 7th 2022)
Happy National Day!!
To celebrate 57 years of Singapore’s independence, I’ll be offering free portfolio review consultation! For a limited time only. https://calendly.com/kennyloh/portfolioconsult
Technical Analysis of FTSE ST REIT Index (FSTAS351020)
FTSE ST Real Estate Investment Trusts (FTSE ST REIT Index) decreased from 807.47 to 828.74 (2.63%) compared to last month’s update. The REIT Index has reversed to a short-term uptrend, with the 20-day and 50-day Simple Moving Average (20 SMA and 50 SMA) now on an uptrend. The 200 SMA has acted as a resistance for the past 10 days. However, these are small changes as the REIT Index is still moving on a sideways direction in the long-term (see 2nd chart below).
- Support Lines: Blue
- Resistance Lines: Red
- Short-term direction: Up
- Medium-term direction: Sideways
- Long-term direction: Sideways
- Immediate Support at 800, 20 SMA, 50 SMA
- Immediate Resistance at 200 SMA
Technically, FTSE ST REIT Index has started a short term uptrend but is currently testing the 200 SMA resistance. Longer term wise the REIT index is still trading in a sideways consolidation range between 800 and 890. The index has to break the 890 resistance convincingly before declaring the “The Returning of the Bull in S-REITs”.

Normal Timeframe chart (~2 years)

Longer Timeframe chart (~3 years)
Previous chart on FTSE ST REIT index can be found in the last post: Singapore REIT Fundamental Comparison Table on July 3rd, 2022.
Fundamental Analysis of 38 Singapore REITs
The following is the compilation of 38 Singapore REITs with colour-coding of the Distribution Yield, Gearing Ratio and Price to NAV Ratio.
- The Financial Ratios are based on past data and there are lagging indicators.
- This REIT table takes into account the dividend cuts due to the COVID-19 outbreak. Yield is calculated trailing twelve months (ttm), therefore REITs with delayed payouts might have lower displayed yields, thus yield displayed might be lower for more affected REITs.
- REITs are updated with the latest Q2 2022 business updates/earnings are highlighted in blue, the rest are updated with Q1 2022 business updates/earning.
- Since MPACT started trading, values shown below (except price and market cap) are of MCT.
- MNACT has been delisted, but values are shown below for reference.
Data from StocksCafe REIT Screener. https://stocks.cafe/kenny/advanced

What does each Column mean?
- FY DPU: If Green, FY DPU for the recent 4 Quarters is higher than that of the preceding 4 Quarters. If Lower, it is Red.
- Most REITs are green since it is compared to FY20/21 as the base (during the pandemic)
- Yield (ttm): Yield, calculated by DPU (trailing twelve months) and Current Price as of August 6th, 2022
- Digital Core REIT: Yield calculated from IPO Prospectus.
- Daiwa House Logistics Trust: Yield calculated from trailing six months distribution.
- Gearing (%): Leverage Ratio.
- Price/NAV: Price to Book Value. Formula: Current Price (as of August 6th, 2022) over Net Asset Value per Unit.
- Yield Spread (%): REIT yield (ttm) reference to Gov Bond Yields. REITs trading in USD is referenced to US Gov Bond Yield, everything else is referenced to SG Gov Bond Yield.
Price/NAV Ratios Overview
- Price/NAV increased to 0.94.
- Increased from 0.92 from July 2022.
- Singapore Overall REIT sector is undervalued now.
- Take note that NAV is adjusted upwards for some REITs due to pandemic recovery.
- Most overvalued REITs (based on Price/NAV)
- Parkway Life REIT (Price/NAV = 2.01)
- Keppel DC REIT (Price/NAV = 1.44)
- Mapletree Industrial Trust (Price/NAV = 1.43)
- Ascendas REIT (Price/NAV = 1. 26)
- Mapletree Logistics Trust (Price/NAV = 1.20)
- ESR-LOGOS REIT (Price/NAV = 1.12)
- No change to the Top 3 compared to the March to July updates.
- Most undervalued REITs (based on Price/NAV)
- Lippo Malls Indonesia Retail Trust (Price/NAV=0.54)
- BHG Retail REIT (Price/NAV = 0.57)
- EC World REIT (Price/NAV = 0.59)
- ARA Hospitality Trust (Price/NAV = 0.63)
- OUE Commercial REIT (Price/NAV = 0.66)
- IREIT Global (Price/NAV = 0.73)
Distribution Yields Overview
- TTM Distribution Yield decreased to 6.32%
- Decreased from 6.45% in July 2022.
- 14 of 40 Singapore REITs have distribution yields of above 7%. (2 less than last month’s update)
- Do take note that these yield numbers are based on current prices taking into account the delayed distribution/dividend cuts due to COVID-19, and economic recovery.
- Highest Distribution Yield REITs (ttm)
- EC World REIT (11.12%)
- United Hampshire REIT (9.84%)
- Prime US REIT (9.75%)
- First REIT (9.56%)
- Sasseur REIT (9.19%)
- Keppel Pacific Oak US REIT (9.12%)
- Reminder that these yield numbers are based on current prices taking into account delayed distribution/dividend cuts due to COVID-19.
- Some REITs opted for semi-annual reporting and thus no quarterly DPU was announced.
- A High Yield should not be the sole ratio to look for when choosing a REIT to invest in.
- Yield Spread widened to 3.67%.
- Increased from 3.54% in July 2022.
Gearing Ratios Overview
- Gearing Ratio decreased to 36.52%.
- Decreased from 36.83% in July 2022.
- Gearing Ratios are updated quarterly. Therefore some of the following REITs have updated gearing ratios compared to last month (those with Q2 2022 updates)
- Highest Gearing Ratio REITs
- ARA Hospitality Trust (43.5%)
- Suntec REIT (43.1%)
- Lippo Malls Indonesia Retail Trust (42.9%)
- Manulife US REIT (42.4%)
- Elite Commercial REIT (41.9%)
- ESR-LOGOS REIT (40.6%)
- No change to the Top 3 compared to the April to July updates.
Market Capitalisation Overview
- Total Singapore REIT Market Capitalisation increased by 3.48% to S$108.6 Billion.
- Increased from S$104.95 Billion in July 2022.
- Biggest Market Capitalisation REITs:
- Capitaland Integrated Commercial Trust ($14.12B)
- Ascendas REIT ($12.59B)
- Mapletree Pan Asia Commercial Trust ($10.05B)
- Mapletree Logistics Trust ($8.48B)
- Mapletree Industrial Trust ($7.20B)
- Frasers Logistics & Commercial Trust ($5.28B)
- MPACT (formerly MCT) moved from 5th to 3rd rank since its merger with MNACT.
- Smallest Market Capitalisation REITs:
- BHG Retail REIT ($267M)
- ARA US Hospitality Trust ($357M)
- Lippo Malls Indonesia Retail Trust ($377M)
- First Trust ($444M)
- EC World REIT ($445M)
- United Hampshire REIT ($477M)
Disclaimer: The above table is best used for “screening and shortlisting only”. It is NOT for investing (Buy / Sell) decision. If you want to know more about investing in REITs, here’s a subsidised 2-day course with all you need to know about REITs and how to start investing in them.
Top 20 Best Performers of the Month in July 2022
(Source: https://stocks.cafe/kenny/advanced)

SG 10 Year & US 10 Year Government Bond Yield
- SG 10 Year: 2.63% (decreased from 2.82%)
- US 10 Year: 2.83% (decreased from 2.92%)

Major REIT News in July 2022
S-REITs Earnings Season for the Period Ending 30 June 2022 has begun
A total of 30 S-REITs have released their earnings/business updates for the Period Ending 30 June 2022 (31 May 2022 for SPH Reit), as of 6th August 2022.
MNACT delists on August 3rd, 2022

Mapletree North Asia Commercial Trust has delisted on August 3rd, 2022, while Mapletree Commercial Trust has renamed to Mapletree Pan Asia Commercial Trust.
Summary
Fundamentally, the whole Singapore REITs landscape is undervalued based on the average Price/NAV value of the S-REITs. Below is the market cap heat map for the past 1 month. Generally, S-REITs in the past month have increased in market cap as July was the bullish month for S-REITs.
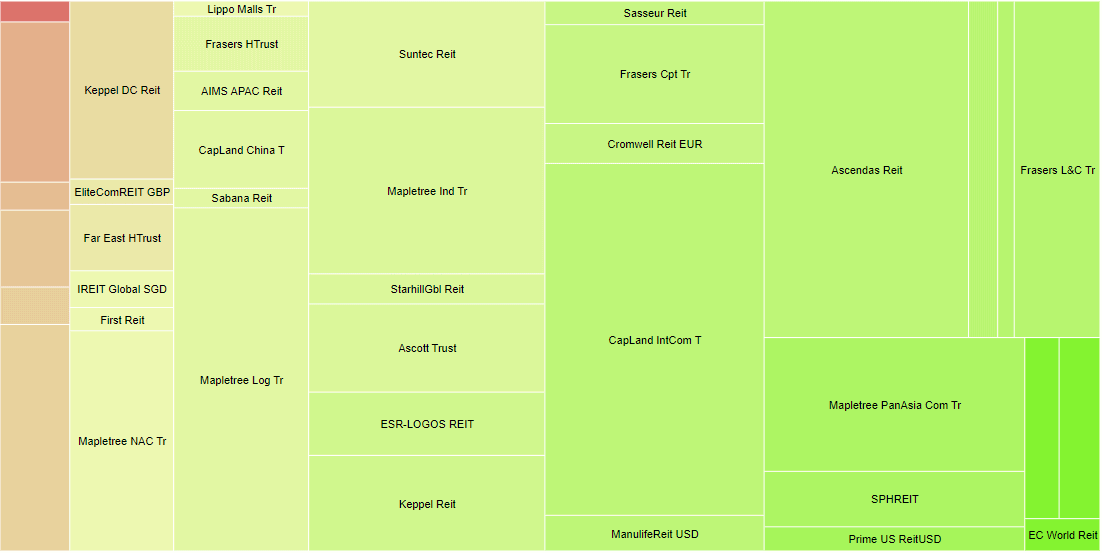
(Source: https://stocks.cafe/kenny/overview)
Yield spread (in reference to the 10 year Singapore government bond of 2.63% as of 7th August 2022) widened from 3.47% to 3.67%. The S-REIT Average Yield increased slightly from 6.30% to 6.32%, while the decrease in the Government Bond Yields more than offsets this Average S-REIT Yield increase. This resulted in the widening of yield spread. The yield of the REITs sector needs to increase to maintain the average yield spread of 4%. S-REITs have been resilient and have one of the highest risk-adjusted dividend yields compared to other stock exchanges.
Technically, FTSE ST REIT Index has started a short term uptrend but is currently testing the 200 SMA resistance. Longer term wise the REIT index is still trading in a sideways consolidation range between 800 and 890. The index has to break the 890 resistance convincingly before declaring the “The Returning of the Bull in S-REITs”.

Note: This above analysis is for my own personal research and it is NOT a buy or sell recommendation. Investors who would like to leverage my extensive research and years of Singapore REIT investing experience can approach me separately for a REIT Portfolio Consultation.
Kenny Loh is an Associate Wealth Advisory Director and REITs Specialist of Singapore’s top Independent Financial Advisor. He helps clients construct diversified portfolios consisting of different asset classes from REITs, Equities, Bonds, ETFs, Unit Trusts, Private Equity, Alternative Investments, Digital Assets and Fixed Maturity Funds to achieve an optimal risk adjusted return. Kenny is also a CERTIFIED FINANCIAL PLANNER, SGX Academy REIT Trainer, Certified IBF Trainer of Associate REIT Investment Advisor (ARIA) and also invited speaker of REITs Symposium and Invest Fair. You can join my Telegram channel #REITirement – SREIT Singapore REIT Market Update and Retirement related news. https://t.me/REITirement


