
Singapore REIT Monthly Update (Mar 6th 2022)
Technical Analysis of FTSE ST REIT Index (FSTAS351020)
FTSE ST Real Estate Investment Trusts (FTSE ST REIT Index) decreased from 816.11 to 827.88 (1.44%) compared to the last month update. The Singapore REIT index rebounded off 800 in January 2022 and has stayed within the 800-836 range.
- Short-term direction: Sideways
- Medium-term direction: Sideways
- Long-term direction: Sideways
- Immediate Support at 800, followed by 775.
- Immediate Resistance at 836.
Following the correction from 800, the REIT Index went on a short-term uptrend until the Russian Invasion of Ukraine, when the REIT Index hit the support level of 807 on both February 24th and 28th. In the past 2 months, it has challenged the resistance of 836 a total of 3 times. It is now at 827.88.

Previous chart on FTSE ST REIT index can be found in the last post: Singapore REIT Fundamental Comparison Table on February 5th, 2022.
Fundamental Analysis of 40 Singapore REITs
The following is the compilation of 40 Singapore REITs with colour coding of the Distribution Yield, Gearing Ratio and Price to NAV Ratio.
- The Financial Ratios are based on past data and there are lagging indicators.
- This REIT table takes into account the dividend cuts due to the COVID-19 outbreak. Yield is calculated trailing twelve months (ttm), therefore REITs with delayed payouts might have lower displayed yields, thus yield displayed might be lower for more affected REITs.
- All REITs are now updated with the latest Q4 2021 business updates/earnings.
- Digital Core REIT has recently IPOed in December (highlighted in yellow) and have their values extracted from IPO Prospectuses. Yield is calculated based on *Estimated DPU (calculated from the Prospectus) / Current Price.
Data from StocksCafe REIT Screener. https://stocks.cafe/kenny/advanced

What does each Column mean?
- FY DPU: If Green, FY DPU for the recent 4 Quarters is higher than that of the preceding 4 Quarters. If Lower, it is Red.
- Most REITs are green since it is compared to 2020 as the base (during the pandemic)
- Yield (ttm): Yield, calculated by DPU (trailing twelve months) and Current Price as of March 5th, 2022
- Daiwa House Log Trust: Yield calculated from IPO Prospectus.
- SPH REIT: Yield calculated from past 4 quarters where distribution has been declared.
- Gearing (%): Leverage Ratio.
- Price/NAV: Price to Book Value. Formula: Current Price (as of March 5th, 2022) over Net Asset Value per Unit.
- Yield Spread (%): REIT yield (ttm) reference to Gov Bond Yields. REITs trading in USD is referenced to US Gov Bond Yield, everything else is referenced to SG Gov Bond Yield.
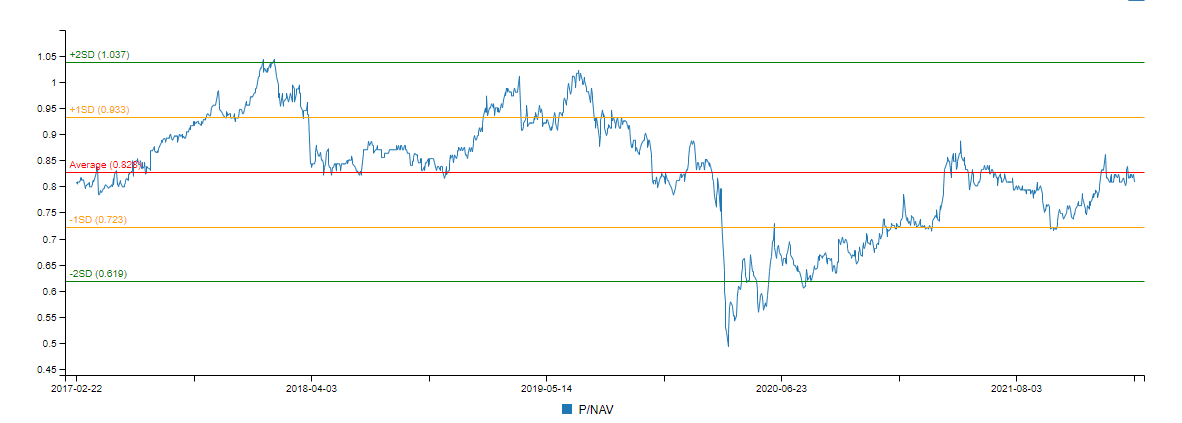
Price/NAV Ratios Overview
- Price/NAV dropped slightly to 0.97.
- Changed from 0.98 from February 2022.
- Singapore Overall REIT sector is slightly undervalued now.
- Take note that NAV is adjusted downward for most REITs due to drop in rental income during the pandemic (Property valuation is done using DCF model or comparative model)
- Most overvalued REITs (based on Price/NAV)
- Parkway Life REIT (Price/NAV = 1.95)
- Keppel DC REIT (Price/NAV = 1.67)
- Mapletree Industrial Trust (Price/NAV = 1.44)
- Digital Core REIT (Price/NAV = 1.33)
- Mapletree Logistics Trust (Price/NAV = 1.31)
- ARA LOGOS Logistics Trust (Price/NAV = 1.25)
- No change in ranking compared to last month (February 5th 2022 update)
- Most undervalued REITs (based on Price/NAV)
- Lippo Malls Indonesia Retail Trust (Price/NAV = 0.54)
- BHG Retail REIT (Price/NAV = 0.59)
- Frasers Hospitality Trust (Price/NAV = 0.67)
- Far East Hospitality Trust (Price/NAV = 0.71)
- OUE Commercial REIT (Price/NAV = 0.72)
- ARA US Hospitality Trust (Price/NAV = 0.72)
- No change in Top 5 ranking compared to last month (February 5th 2022 update).
Distribution Yields Overview
- TTM Distribution Yield increased slightly to 6.00%.
- Increased from 5.97% in February 2022.
- 12 of 40 Singapore REITs have distribution yields of above 7%.
- Do take note that these yield numbers are based on current prices taking into account the delayed distribution/dividend cuts due to COVID-19, and economic recovery.
- Highest Distribution Yield REITs (ttm)
- United Hampshire REIT (9.76%)
- Prime US REIT (8.86%)
- Keppel Pacific Oak US REIT (8.81%)
- First REIT (8.70%)
- Elite Commercial REIT (8.42%)
- EC World REIT (8.41%)
- Reminder that these yield numbers are based on current prices taking into account delayed distribution/dividend cuts due to COVID-19.
- Some REITs opted for semi-annual reporting and thus no quarterly DPU was announced.
- A High Yield should not be the sole ratio to look for when choosing a REIT to invest in.
- Yield Spread decreased to 4.14%.
- Decreased from 4.18% in February 2022.
Gearing Ratios Overview
- Gearing Ratio decreased to 37.04%.
- Decreased from 37.48% in February 2022.
- Gearing Ratios are updated quarterly. All REITs have released their Q4 2021 business updates/earnings, hence have updated gearing ratios
- In general, Singapore REITs sector gearing ratio is healthy but increased due to the reduction of the valuation of portfolios and an increase in borrowing due to Covid-19.
- Highest Gearing Ratio REITs
- ARA Hospitality Trust (44.3%)
- Suntec REIT (43.7%)
- Manulife US REIT (42.8%)
- Frasers Hospitality Trust (42.5%)
- Lippo Malls Retail Trust (42.5%)
- Elite Commercial REIT (42.4%)
Market Capitalisation Overview
- Total Singapore REIT Market Capitalisation increased by 1.77% to S$106.86 Billion.
- Increased from S$105.0 Billion in February 2022.
- Biggest Market Capitalisation REITs:
- Capitaland Integrated Commercial Trust ($13.73B)
- Ascendas REIT ($11.82B)
- Mapletree Logistics Trust ($8.36B)
- Mapletree Industrial Trust ($6.92B)
- Mapletree Commercial Trust ($6.08B)
- Frasers Logistics & Commercial Trust ($5.34B)
- No change in Top 5 rankings since August 2021.
- Smallest Market Capitalisation REITs:
- BHG Retail REIT ($279M)
- ARA US Hospitality Trust ($389M)
- Lippo Malls Indonesia Retail Trust ($391M)
- United Hampshire REIT ($423M)
- First REIT ($482M)
- Sabana REIT ($487M)
Disclaimer: The above table is best used for “screening and shortlisting only”. It is NOT for investing (Buy / Sell) decision. If you want to know more about investing in REITs, here’s a subsidised 2-day course with all you need to know about REITs and how to start investing in them.
Top 20 Best Performers of the Month in February 2022
(Source: https://stocks.cafe/kenny/advanced)

SG 10 Year & US 10 Year Government Bond Yield
- SG 10 Year: 1.84% (increased from 1.78%)
- US 10 Year: 1.77% (decreased from 1.92%)

Major REIT News in February 2022
S-REITs Earnings Season for the Period Ending 31 Dec 2021 has wrapped up
A total of 40 S-REITs have released their earnings/business updates for the Period Ending 31 Dec 2021 (30 Nov 2021 for SPH Reit). In summary (Daiwa House Log Trust and Digital Core REIT not included):
2021 vs 2020 Distribution change
30 of 38 REITs have increased in DPU y-o-y (>1% growth)
0 of 38 REITs have unchanged DPU y-o-y (Less than 1% Change)
8 of 38 REITs have decreased in DPU y-o-y (>1% decline)

NAV/Unit values (year-on-year change, Q4 2021 vs Q4 2020):
22 of 38 REITs have increased NAV/Unit values
4 of 38 REITs have unchanged NAV/Unit values
12 of 38 REITs have decreased NAV/Unit values

Summary
Fundamentally, the whole Singapore REITs landscape is undervalued due to the recent correction based on the average Price/NAV value of the S-REITs. Below is the market cap heat map for the past 1 month. Generally, S-REITs in the past month have increased in market cap.

(Source: https://stocks.cafe/kenny/overview)
Yield spread (in reference to the 10 year Singapore government bond of 1.78% as of 5th February 2021) tightened slightly from 4.18% to 4.14%. The S-REIT Average Yield remained almost the same, but with a slight increase in Singapore Government Bond Yields from 1.78% to 1.84%, Yield Spread tightened slightly.
The risk premium remains attractive (compared to other asset classes) to accumulate Singapore REITs in stages to lock in the current price and to benefit from long-term yield after the recovery, especially since the S-REIT Market is undervalued. Moving forward, it is expected that DPU will continue to increase due to the recovery of the global economy, as seen in the previous few earning updates, especially for Hospitality REITs. NAV is expected to be adjusted upward due to revaluation of the portfolio.
Technically the FTSE ST REIT index is currently moving sideways. After challenging the resistance of 836 for 3 times, if the REIT Index breaks the resistance, it is expected to breakout. If the REIT Index breaks down below to current 800 support level, the next support is expected to be at 775. Otherwise, the REIT Index is currently moving sideways, trading between 800 and 836.
You can listen to my monthly REIT radio interview on MoneyFM89.3 here.
Note: This above analysis is for my own personal research and it is NOT a buy or sell recommendation. Investors who would like to leverage my extensive research and years of Singapore REIT investing experience can approach me separately for a REIT Portfolio Consultation.
Kenny Loh is a Senior Financial Advisory Manager and REITs Specialist of Singapore’s top Independent Financial Advisor. He helps clients construct diversified portfolios consisting of different asset classes from REITs, Equities, Bonds, ETFs, Unit Trusts, Private Equity, Alternative Investments, Digital Assets and Fixed Maturity Funds to achieve an optimal risk adjusted return. Kenny is also a CERTIFIED FINANCIAL PLANNER, SGX Academy REIT Trainer, Certified IBF Trainer of Associate REIT Investment Advisor (ARIA) and also invited speaker of REITs Symposium and Invest Fair. You can join my Telegram channel #REITirement – SREIT Singapore REIT Market Update and Retirement related news. https://t.me/REITirement


