Singapore REIT Monthly Update (January 1st, 2023)

  • Post author:

Happy New Year!!

Technical Analysis of FTSE ST REIT Index (FSTAS351020)


FTSE ST Real Estate Investment Trusts (FTSE ST REIT Index) increased from 723.18 to 725.07 (0.26%) compared to last month’s update. The REIT Index has rebounded from the sell-off in September and October and since early November has been within the range of 714 and 742. It has been moving sideways for the past 2 months. This is a typical flag pattern after a strong move.

  • Short-term direction: Sideways (20D SMA is moving sideways)
  • Medium-term direction: Sideways (50D SMA is moving sideways)
  • Long-term direction Down (200D SMA is sloping down)
  • Immediate Support at 714
  • Immediate Resistance at 742

2 years FTSE REIT Index Chart

Previous chart on FTSE ST REIT index can be found in the last post: Singapore REIT Fundamental Comparison Table on December 4th, 2022.

Fundamental Analysis of 38 Singapore REITs


The following is the compilation of 38 Singapore REITs with colour-coding of the Distribution Yield, Gearing Ratio and Price to NAV Ratio.

  • The Financial Ratios are based on past data and these are lagging indicators.
  • This REIT table takes into account the dividend cuts due to the COVID-19 outbreak. Yield is calculated trailing twelve months (ttm), therefore REITs with delayed payouts might have lower displayed yields, thus yield displayed might be lower for more affected REITs.
  • All REITs highlighted in orange are now updated with the latest Q3 2022 business updates/earnings.
  • SPH Reit will be renamed to Paragon REIT from January 3rd, 2023, onwards.
  • Manulife US REIT (highlighted in blue) has Gearing, Price/NAV and NAV/Unit values updated according to the recent media conference. 

Data from StocksCafe REIT Screener. https://stocks.cafe/kenny/advanced

What does each Column mean?

  • FY DPU: If Green, FY DPU for the recent 4 Quarters is higher than that of the preceding 4 Quarters. If Lower, it is Red.
  • Yield (ttm): Yield, calculated by DPU (trailing twelve months) and Current Price as of December 30th 2022.
    • Digital Core REIT and Daiwa House Logistics Trust: Yield calculated from trailing six months distribution, TTM yield is annualised.
  • Gearing (%): Leverage Ratio.
  • Price/NAV: Price to Book Value. Formula: Current Price over Net Asset Value per Unit.
  • Yield Spread (%): REIT yield (ttm) reference to Gov Bond Yields. REITs trading in USD is referenced to US Gov Bond Yield, everything else is referenced to SG Gov Bond Yield.
  •  

Price/NAV Ratios Overview

  • Price/NAV remained at 0.80. 
    • Remained at 0.80 since December 2022.
    • There has been a recent sell-off in September-October period.
    • Singapore Overall REIT sector is undervalued now.
    • Take note that NAV is adjusted upwards for some REITs due to pandemic recovery.
  • Most overvalued REITs (based on Price/NAV)
    • Parkway Life REIT (Price/NAV = 1.58)
    • Keppel DC REIT (Price/NAV = 1.29)
    • Capitaland Ascendas REIT (Price/NAV = 1.15)
    • Mapletree Industrial Trust (Price/NAV = 1.15)
    • Mapletree Logistics Trust (Price/NAV = 1.09)
    • ESR-LOGOS REIT (Price/NAV = 1.01)
    • Only 6 REITs are overvalued now based on Price/NAV value.
    • No change in the Top 2 compared to the past 2 months.
  • Most undervalued REITs (based on Price/NAV)
    • Lippo Malls Indonesia Retail Trust (Price/NAV=0.34)
    • Prime US REIT (Price/NAV = 0.47)
    • ARA US Hospitality Trust (Price/NAV = 0.49)
    • Manulife US REIT (Price/NAV = 0.55)
    • Keppel Pacific Oak US REIT (Price/NAV = 0.55)
    • EC World REIT (Price/NAV = 0.56)

Distribution Yields Overview

  • TTM Distribution Yield increased to 7.90%.
    • Increased from 7.67% in December 2022.
    • 19 of 40 Singapore REITs have distribution yields of above 7%.
    • Do take note that these yield numbers are based on current prices taking into account the delayed distribution/dividend cuts due to COVID-19, and economic recovery. The recent sell-off contributed to the increase in average yield.
    • 9 REITs have a ttm yield of over 10%!
  • Highest Distribution Yield REITs (ttm)
    • Manulife US REIT (17.67%)
    • Prime US REIT (17.21%)
    • Keppel Pacific Oak US REIT (13.48%)
    • United Hampshire US REIT (12.82%)
    • EC World REIT (12.74%)
    • Lippo Malls Indonesia Retail Trust (12.00%)
    • Reminder that these yield numbers are based on current prices taking into account delayed distribution/dividend cuts due to COVID-19.
    • Some REITs opted for semi-annual reporting and thus no quarterly DPU was announced.
    • A High Yield should not be the sole ratio to look for when choosing a REIT to invest in.
  • Yield Spread widened to 4.69%.
    • Widened slightly from 4.61% in December 2022.

Gearing Ratios Overview

  • Gearing Ratio increased to 37.20%. 
    • Increased from 37.03% from December 2022.
    • Gearing Ratios are updated quarterly. Only Manulife US REIT have an updated gearing ratio value in the past month.
  • Highest Gearing Ratio REITs
    • Manulife US REIT (49.0%)
    • Lippo Malls Indonesia Retail Trust (43.7%)
    • ARA Hospitality Trust (43.3%)
    • Suntec REIT (43.1%)
    • United Hampshire US REIT (42.1%)
    • Elite Commercial REIT (41.9%)

Market Capitalisation Overview

  • Total Singapore REIT Market Capitalisation increased by 0.26% to S$95.36 Billion.
    • Increased from S$95.11 Billion in December 2022.
  • Biggest Market Capitalisation REITs:
    • Capitaland Integrated Commercial Trust ($13.52B)
    • Capitaland Ascendas REIT ($11.51B)
    • Mapletree Pan Asia Commercial Trust ($8.74B)
    • Mapletree Logistics Trust ($7.64B)
    • Mapletree Industrial Trust ($6.00B)
    • Frasers Logistics & Commercial Trust ($4.31B)
    • No change in the rankings since September 2022.
  • Smallest Market Capitalisation REITs:
    • Lippo Malls Indonesia Retail Trust ($231M)
    • BHG Retail REIT ($257M)
    • ARA Hospitality Trust ($267M)
    • United Hampshire US REIT ($349M)
    • EC World REIT ($360M)
    • Elite Commercial REIT ($365M)
    • No change in the top 3 rankings from last 2 month’s update.

Disclaimer: The above table is best used for “screening and shortlisting only”. It is NOT for investing (Buy / Sell) decision. If you want to know more about investing in REITs, here’s a subsidised 2-day course with all you need to know about REITs and how to start investing in them.

Top 20 Worst Performers of the Month in December 2022


 (Source: https://stocks.cafe/kenny/advanced)

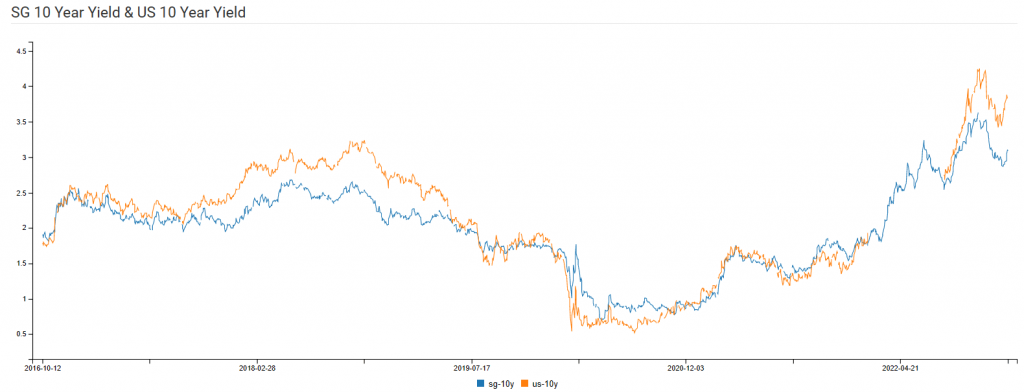
SG 10 Year & US 10 Year Government Bond Yield

  • SG 10 Year: 3.11% (increased from 3.00%)
  • US 10 Year: 3.88% (increased from 3.49%)

Major REIT News in December 2022


Hong Kong’s Link Real Estate Investment Trust (REIT) enters Singapore market

CNA: Hong Kong-listed Link Real Estate Investment Trust (REIT) is buying a portfolio of Singapore shopping malls for S$2.16 billion (US$1.6 billion) from Mercatus Co-operative in its first foray into the country. The deal is for the acquisition of suburban retail assets Jurong Point and Swing By @ Thomson Plaza, along with a 10-year asset and property management service agreement for a third suburban mall, AMK Hub, which will remain under the ownership of Mercatus, Link REIT said in a stock exchange filing on Wednesday (Dec 28).

“This transaction allows us to build a dedicated team in Singapore and provides a base for Link to expand further into other asset classes and strategies in Asia Pacific,” Link CEO George Hongchoy said in a statement. Link, Asia’s biggest REIT, said it will fully fund the purchase through cash and debt, adding that it is in active discussions with investors and open to bringing in capital partners.

The announcement confirms a Reuters report in November that cited sources saying Link REIT was the frontrunner to buy the assets from Mercatus, a unit of Singapore shopping mall owner NTUC Enterprise Co-operative, in what would be Southeast Asia’s biggest real estate transaction of 2022. Read More

SPH REIT renames to Paragon REIT from January 3rd, 2023

THE BUSINESS TIMES: SPH Real Estate Investment Trust (Reit) will be renamed to Paragon Reit as the name change will better reflect the trust’s vision and mission to capture unique opportunities in the Asia-Pacific retail landscape, the Reit manager said on Thursday (Dec 29). The names of its security, counter and manager – along with the Reit’s logo and website – will reflect the new name with effect from 9 am on Jan 3, 2023. The Reit manager added that the trust will be “bolstered by the deep real estate sector knowledge and strong relationships” of its sponsor, Cuscaden Peak Investments.


Cuscaden Peak Investments was formerly known as Singapore Press Holdings, and is a wholly-owned subsidiary of Cuscaden Peak. Cuscaden Peak is a consortium comprising tycoon Ong Beng Seng’s Hotel Properties Limited, and Temasek-linked CLA Real Estate Holdings and Mapletree. The Reit’s existing counter code – “SK6U” – on the Singapore Exchange will remain unchanged.

It will also continue to be led by the current management team, retain its investment mandate, and manage its existing portfolio of assets. Read More


Summary


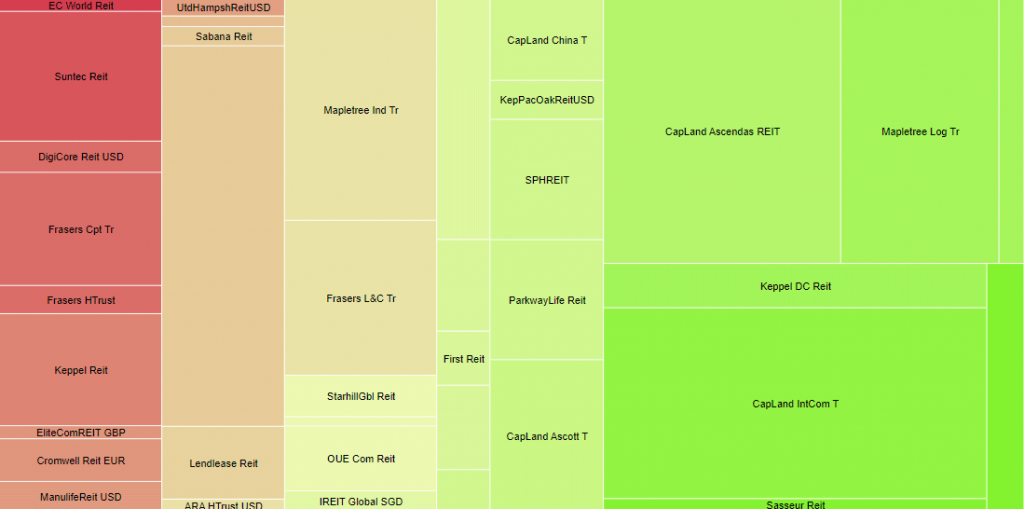
Fundamentally, the whole Singapore REITs landscape remains very undervalued based on the average Price/NAV (at 0.80) value of the S-REITs, which is quite rare that S-REIT is trading at such huge discount with a very attractive DPU yield of 7.90%! This is even higher than that of last month. Below is the market cap heat map for the past 1 month.

Interestingly, despite 24 REITs being bearish and only 10 REITs being bullish in the past month, market cap overall has increased very slightly by 0.26%. This is due to larger market cap REITs doing well (eg. Capitaland Ascott Trust (S$3.5B, 11.11%), ESR-LOGOS REIT (S$2.5B, 7.25%), Frasers Centrepoint Trust (S$3.6B, 3.45%). Only 3 of the bottom 12 performing REITs have market capitalisations of over S$1B. The top 5 largest Market Cap REITs have performances varying between -0.45% and -2.34%.

(Source: https://stocks.cafe/kenny/overview)

Yield spread (in reference to the 10-year Singapore government bond yield of 3.11% as of 30th December 2022) widened from 4.61% to 4.69%. This is a slight increase of 0.08% due to the share price erosion outpaces in the increase of the risk-free rate. 

Technically, FTSE ST REIT Index is trading in a bearish territory but rebounded strongly from the support level. The index is forming a flag pattern (either bull flag or bear flag) and future direction is unknown until the breakout. Breaking up from the flag pattern shows the continuation of the bullish rebound. However, breaking down from the flag pattern indicates the previous rebound is just a dead cat bounce and the REIT index may crash down to test the support of 665 level.  Based on the current overall S-REIT P/NAV of 0.80 and the potential peaking of interest rate in Q2/Q3 2023, the probability to have a severe crash in S-REIT is low unless we are entering into severe recession with big drop in DPU and US Fed continues to increase the interest rate fiercely beyond 5%.

Interview with Phillip Capital: Get A Slice of Property Action with REITs


Recently I had an interview with The Financial Coconut. You can view the video below. Questions that I answered include:

  • About Kenny Loh (0:50)
  • Short to mid-term outlook for global markets (1:11)
  • Current Investment Sentiments (1:54)
  • What is the best time to invest? Why invest during the bear market (3:15)
  • What sectors/asset classes should I invest in? (3:43) REITs’ valuation per unit has reached lower than during the 2020 COVID Crash.
  • Why REITs are very attractive now & market outlook (4:40)
  • What is a REIT? (6:48)
  • Pros and Cons of investing in REITs. Are REITs the right investment instrument for you? (7:55)
  • What are Thematic Portfolios? (Portfolio Themes) (9:17)
    • Technology Disruption
    • China’s Economic Growth
    • Decarbonisation
  • Advice on weathering the current grim investment outlook (11:36)
  •  

Note: This above analysis is for my own personal research and it is NOT a buy or sell recommendation. Investors who would like to leverage my extensive research and years of Singapore REIT investing experience can approach me separately for a REIT Portfolio Consultation.

Kenny Loh is an Associate Wealth Advisory Director and REITs Specialist of Singapore’s top Independent Financial Advisor. He helps clients construct diversified portfolios consisting of different asset classes from REITs, Equities, Bonds, ETFs, Unit Trusts, Private Equity, Alternative Investments, Digital Assets and Fixed Maturity Funds to achieve an optimal risk adjusted return. Kenny is also a CERTIFIED FINANCIAL PLANNER, SGX Academy REIT Trainer, Certified IBF Trainer of Associate REIT Investment Advisor (ARIA) and also invited speaker of REITs Symposium and Invest Fair.  You can join my Telegram channel #REITirement – SREIT Singapore REIT Market Update and Retirement related news. https://t.me/REITirement

Continue ReadingSingapore REIT Monthly Update (January 1st, 2023)

Singapore REIT Monthly Update (December 4th 2022)

  • Post author:

It’s the festive season again! Wishing everyone a very Merry Christmas and a Happy New Year. I have a short 13-minute-long video interview with Phillip Capital, touching on the current REIT market and what can investors do to take advantage of it. Why is it currently a great time to go REITs shopping? You can view the video ‘Teatime Tuesday: Get A Slice Of Property Action With REITs’ in at the bottom of this article.


Technical Analysis of FTSE ST REIT Index (FSTAS351020)


FTSE ST Real Estate Investment Trusts (FTSE ST REIT Index) decreased from 737.39 to 723.18 (-1.91%) compared to last month’s update. The REIT Index is rebounding and trading in an upward parallel channel. The 20D SMA has just crossing up the 50D SMA indicate a short-term bullish up trend. 

  • Short-term direction: Up (Parallel Channel, 20D SMA is sloping up)
  • Medium-term direction: Down (50D SMA is sloping down)
  • Long-term direction Down (200D SMA is sloping down)
  • Immediate Support at 720 (Parallel Channel, 20D SMA)
  • Immediate Resistance at 747

2 years FTSE REIT Index Chart


Previous chart on FTSE ST REIT index can be found in the last post: Singapore REIT Fundamental Comparison Table on November 13rd, 2022.


Fundamental Analysis of 38 Singapore REITs


The following is the compilation of 38 Singapore REITs with colour-coding of the Distribution Yield, Gearing Ratio and Price to NAV Ratio.

  • The Financial Ratios are based on past data and there are lagging indicators.
  • This REIT table takes into account the dividend cuts due to the COVID-19 outbreak. Yield is calculated trailing twelve months (ttm), therefore REITs with delayed payouts might have lower displayed yields, thus yield displayed might be lower for more affected REITs.
  • All REITs highlighted are now updated with the latest Q3 2022 business updates/earnings.
  • Ascott Residence Trust has been renamed to Capitaland Ascott Trust. Ascendas REIT has been renamed to Capitaland Ascendas REIT.

Data from StocksCafe REIT Screener. https://stocks.cafe/kenny/advanced


What does each Column mean?

  • FY DPU: If Green, FY DPU for the recent 4 Quarters is higher than that of the preceding 4 Quarters. If Lower, it is Red.
  • Yield (ttm): Yield, calculated by DPU (trailing twelve months) and Current Price as of December 2nd 2022.
    • Digital Core REIT and Daiwa House Logistics Trust: Yield calculated from trailing six months distribution, TTM yield is annualised.
  • Gearing (%): Leverage Ratio.
  • Price/NAV: Price to Book Value. Formula: Current Price over Net Asset Value per Unit.
  • Yield Spread (%): REIT yield (ttm) reference to Gov Bond Yields. REITs trading in USD is referenced to US Gov Bond Yield, everything else is referenced to SG Gov Bond Yield.
  •  

Price/NAV Ratios Overview

  • Price/NAV decreased slightly to 0.80.
    • Decreased from 0.81 from November 2022.
    • There has been a recent sell-off in September-October period.
    • Singapore Overall REIT sector is undervalued now.
    • Take note that NAV is adjusted upwards for some REITs due to pandemic recovery.
  • Most overvalued REITs (based on Price/NAV)
    • Parkway Life REIT (Price/NAV = 1.61)
    • Keppel DC REIT (Price/NAV = 1.33)
    • Capitaland Ascendas REIT (Price/NAV = 1.15)
    • Mapletree Industrial Trust (Price/NAV = 1.14)
    • Mapletree Logistics Trust (Price/NAV = 1.10)
    • SPH REIT (Price/NAV = 0.98)
    • Only 5 REITs are overvalued now based on Price/NAV value.
    • No change in the Top 2 compared to last month.
  • Most undervalued REITs (based on Price/NAV)
    • Lippo Malls Indonesia Retail Trust (Price/NAV=0.34)
    • ARA Hospitality Trust (Price/NAV = 0.53)
    • Manulife US REIT (Price/NAV = 0.54)
    • Prime US REIT (Price/NAV = 0.55)
    • EC World REIT (Price/NAV = 0.56)
    • BHG Retail REIT (Price/NAV = 0.57)
    • No change in the Top 3 compared to last month.

Distribution Yields Overview

  • TTM Distribution Yield increased to 7.67%.
    • Increased from 7.58% in November 2022.
    • 18 of 40 Singapore REITs have distribution yields of above 7%. (same as last 2 months’ update)
    • Do take note that these yield numbers are based on current prices taking into account the delayed distribution/dividend cuts due to COVID-19, and economic recovery. The recent sell-off contributed to the increase in average yield.
    • 9 REITs have a ttm yield of over 10%!
  • Highest Distribution Yield REITs (ttm)
    • Prime US REIT (14.67%)
    • Manulife US REIT (13.97%)
    • EC World REIT (12.60%)
    • United Hampshire US REIT (12.16%)
    • Lippo Malls Indonesia Retail Trust (12.00%)
    • Keppel Pacific Oak US REIT (11.38%)
    • Reminder that these yield numbers are based on current prices taking into account delayed distribution/dividend cuts due to COVID-19.
    • Some REITs opted for semi-annual reporting and thus no quarterly DPU was announced.
    • A High Yield should not be the sole ratio to look for when choosing a REIT to invest in.
  • Yield Spread widened to 4.61%.
    • Widened from 4.17% in November 2022.

Gearing Ratios Overview

  • Gearing Ratio remained at 37.03%. 
    • Remained at 37.03% in November 2022.
    • Gearing Ratios are updated quarterly. Therefore, no REITs have updated their gearing ratios in the past month.
  • Highest Gearing Ratio REITs
    • Lippo Malls Indonesia Retail Trust (43.7%)
    • ARA Hospitality Trust (43.3%)
    • Suntec REIT (43.1%)
    • Manulife US REIT (42.5%)
    • United Hampshire US REIT (42.1%)
    • Elite Commercial REIT (41.9%)

Market Capitalisation Overview

  • Total Singapore REIT Market Capitalisation decreased by 1.16% to S$95.11 Billion.
    • Decreased from S$96.23 Billion in November 2022.
  • Biggest Market Capitalisation REITs:
    • Capitaland Integrated Commercial Trust ($13.39B)
    • Capitaland Ascendas REIT ($11.55B)
    • Mapletree Pan Asia Commercial Trust ($8.64B)
    • Mapletree Logistics Trust ($7.68B)
    • Mapletree Industrial Trust ($5.95B)
    • Frasers Logistics & Commercial Trust ($4.18B)
    • No change in the rankings since September 2022.
  • Smallest Market Capitalisation REITs:
    • Lippo Malls Indonesia Retail Trust ($231M)
    • BHG Retail REIT ($257M)
    • ARA Hospitality Trust ($289M)
    • EC World REIT ($364M)
    • United Hampshire US REIT ($371M)
    • Elite Commercial REIT ($394M)
    • No change in the rankings from last month’s update.

Disclaimer: The above table is best used for “screening and shortlisting only”. It is NOT for investing (Buy / Sell) decision. If you want to know more about investing in REITs, here’s a subsidised 2-day course with all you need to know about REITs and how to start investing in them.


Top 20 Best Performers of the Month in November 2022


 (Source: https://stocks.cafe/kenny/advanced)


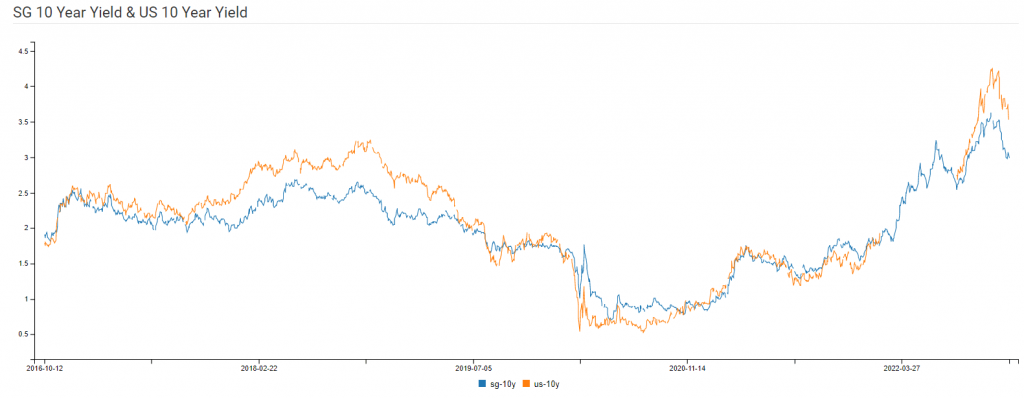
SG 10 Year & US 10 Year Government Bond Yield

  • SG 10 Year: 3.00% (decreased from 3.48%)
  • US 10 Year: 3.49% (decreased from 3.82%)


Major REIT News in November 2022


There are no major REIT happenings for the month of November 2022.


Summary


Fundamentally, the whole Singapore REITs landscape is very undervalued based on the average Price/NAV (at 0.80) value of the S-REITs, which is quite rare that S-REIT is trading at such huge discount with a very attractive DPU yield of 7.67%! This is even higher than that of last month. Below is the market cap heat map for the past 1 month. The performance of REITs are evenly split. 18 REITs have been bullish while 15 REITs have been bearish the last 30 days. There is no clear correlation with market cap in terms of performance.


(Source: https://stocks.cafe/kenny/overview)

Yield spread (in reference to the 10-year Singapore government bond yield of 3.00% as of 3rd December 2022) widened from 4.17% to 4.61%. This is a huge increase of 0.44%. This is due to the large decrease in Government Bond Yields (about 0.40%), while the S-REIT Average Yield increased from 7.58% to 7.67%. This resulted in the widening of the yield spread. 

Technically, FTSE ST REIT Index is trading in a bearish territory but rebounded strongly from the support level. Based on the past chart patterns, REIT Index used to have a strong V-shaped rebound when there was a huge sell off with a very attractive valuation & DPU yield. Is this a bull trap or dead cat bounce? Is this the time to do bottom fishing to lock in the current attractive valuation and yield? Or is it better to wait for a very clear bull signal first before investing in Singapore REITs? No one will know the exact answer but more importantly investors should focus on their own financial objective, time horizon and risk appetite. 


Interview with Phillip Capital: Get A Slice of Property Action with REITs


Recently I had an interview with PYTCH Media by Phillip Capital. You can view the video below. Questions that I answered include:

  • About Kenny Loh (0:50)
  • Short to mid-term outlook for global markets (1:11)
  • Current Investment Sentiments (1:54)
  • What is the best time to invest? Why invest during the bear market (3:15)
  • What sectors/asset classes should I invest in? (3:43) REITs’ valuation per unit has reached lower than during the 2020 COVID Crash.
  • Why REITs are very attractive now & market outlook (4:40)
  • What is a REIT? (6:48)
  • Pros and Cons of investing in REITs. Are REITs the right investment instrument for you? (7:55)
  • What are Thematic Portfolios? (Portfolio Themes) (9:17)
    • Technology Disruption
    • China’s Economic Growth
    • Decarbonisation
  • Advice on weathering the current grim investment outlook (11:36)


Note: This above analysis is for my own personal research and it is NOT a buy or sell recommendation. Investors who would like to leverage my extensive research and years of Singapore REIT investing experience can approach me separately for a REIT Portfolio Consultation.

Kenny Loh is an Associate Wealth Advisory Director and REITs Specialist of Singapore’s top Independent Financial Advisor. He helps clients construct diversified portfolios consisting of different asset classes from REITs, Equities, Bonds, ETFs, Unit Trusts, Private Equity, Alternative Investments, Digital Assets and Fixed Maturity Funds to achieve an optimal risk adjusted return. Kenny is also a CERTIFIED FINANCIAL PLANNER, SGX Academy REIT Trainer, Certified IBF Trainer of Associate REIT Investment Advisor (ARIA) and also invited speaker of REITs Symposium and Invest Fair.  You can join my Telegram channel #REITirement – SREIT Singapore REIT Market Update and Retirement related news. https://t.me/REITirement

Continue ReadingSingapore REIT Monthly Update (December 4th 2022)

Singapore REIT Monthly Update (November 13th 2022)

  • Post author:

This article is published 1 week later, to allow for all REIT earnings to be completed. All values are now updated to the latest Q3 2022 earnings / business updates.


Technical Analysis of FTSE ST REIT Index (FSTAS351020)


FTSE ST Real Estate Investment Trusts (FTSE ST REIT Index) decreased from 737.01 to 731.39 (-0.76%) compared to last month’s update. From October 7th to October 21st, S-REITs sold off and reaching a low of 661. The last time the REIT Index hit 661 is on April 2nd, 2020, 13 days after the March 2020 crash. However, the REIT Index rebounded strongly back to 731 on Friday, November 11th with a gap up. This is a strong reversal candlestick pattern if the FTSE ST REIT Index does not close the gap and stays above this level in the next few trading sessions.

  • Short-term direction: Up (Price Action – Gap up)
  • Medium-term direction: Down (50D SMA is sloping down)
  • Long-term direction Down (200D SMA is sloping down)
  • Immediate Support at 718.4 (Gap Resistance)
  • Immediate Resistance at 772

Chart with longer timeframe (~3 years)


Previous chart on FTSE ST REIT index can be found in the last post: Singapore REIT Fundamental Comparison Table on Oct 2nd, 2022.


Fundamental Analysis of 38 Singapore REITs


The following is the compilation of 38 Singapore REITs with colour-coding of the Distribution Yield, Gearing Ratio and Price to NAV Ratio.

  • The Financial Ratios are based on past data and there are lagging indicators.
  • This REIT table takes into account the dividend cuts due to the COVID-19 outbreak. Yield is calculated trailing twelve months (ttm), therefore REITs with delayed payouts might have lower displayed yields, thus yield displayed might be lower for more affected REITs.
  • All REITs highlighted are now updated with the latest Q3 2022 business updates/earnings.
  • Ascott Residence Trust has been renamed to Capitaland Ascott Trust. Ascendas REIT has been renamed to Capitaland Ascendas REIT.

Data from StocksCafe REIT Screener. https://stocks.cafe/kenny/advanced


What does each Column mean?

  • FY DPU: If Green, FY DPU for the recent 4 Quarters is higher than that of the preceding 4 Quarters. If Lower, it is Red.
    • Most REITs are green since it is compared to FY20/21 as the base (during the pandemic)
  • Yield (ttm): Yield, calculated by DPU (trailing twelve months) and Current Price as of November 11th 2022.
    • Digital Core REIT and Daiwa House Logistics Trust: Yield calculated from trailing six months distribution, TTM yield is annualised.
  • Gearing (%): Leverage Ratio.
  • Price/NAV: Price to Book Value. Formula: Current Price over Net Asset Value per Unit.
  • Yield Spread (%): REIT yield (ttm) reference to Gov Bond Yields. REITs trading in USD is referenced to US Gov Bond Yield, everything else is referenced to SG Gov Bond Yield.
  •  

Price/NAV Ratios Overview

  • Price/NAV decreased to 0.81.
    • Decreased from 0.83 from October 2022.
    • This is due to the recent sell-off.
    • Singapore Overall REIT sector is undervalued now.
    • Take note that NAV is adjusted upwards for some REITs due to pandemic recovery.
  • Most overvalued REITs (based on Price/NAV)
    • Parkway Life REIT (Price/NAV = 1.75)
    • Keppel DC REIT (Price/NAV = 1.34)
    • Mapletree Industrial Trust (Price/NAV = 1.19)
    • Capitaland Ascendas REIT (Price/NAV = 1.15)
    • Mapletree Logistics Trust (Price/NAV = 1.10)
    • Mapletree PAC Trust (Price/NAV = 0.98)
    • Only 5 REITs are overvalued now based on Price/NAV value.
  • Most undervalued REITs (based on Price/NAV)
    • Lippo Malls Indonesia Retail Trust (Price/NAV=0.36)
    • ARA Hospitality Trust (Price/NAV = 0.52)
    • Manulife US REIT (Price/NAV = 0.54)
    • BHG Retail REIT (Price/NAV = 0.57)
    • EC World REIT (Price/NAV = 0.57)
    • OUE Commercial REIT (Price/NAV = 0.60)

Distribution Yields Overview

  • TTM Distribution Yield Increased to 7.58%.
    • Increased from 7.30% in October 2022.
    • 18 of 40 Singapore REITs have distribution yields of above 7%. (same as last month’s update)
    • Do take note that these yield numbers are based on current prices taking into account the delayed distribution/dividend cuts due to COVID-19, and economic recovery. The recent sell-off contributed to the increase in average yield.
    • 9 REITs have a ttm yield of over 10%!
  • Highest Distribution Yield REITs (ttm)
    • Manulife US REIT (13.97%)
    • Prime US REIT (13.53%)
    • EC World REIT (12.46%)
    • United Hampshire US REIT (11.92%)
    • Lippo Malls Indonesia Retail Trust (11.61%)
    • Keppel Pacific Oak US REIT (10.88%)
    • Reminder that these yield numbers are based on current prices taking into account delayed distribution/dividend cuts due to COVID-19.
    • Some REITs opted for semi-annual reporting and thus no quarterly DPU was announced.
    • A High Yield should not be the sole ratio to look for when choosing a REIT to invest in.
  • Yield Spread widened to 4.17%.
    • Increased from 3.76% in October 2022.

Gearing Ratios Overview

  • Gearing Ratio increased to 37.03%. 
    • Increased from 36.68% in October 2022.
    • Gearing Ratios are updated quarterly.
  • Highest Gearing Ratio REITs
    • Lippo Malls Indonesia Retail Trust (43.7%)
    • ARA Hospitality Trust (43.3%)
    • Suntec REIT (43.1%)
    • Manulife US REIT (42.5%)
    • United Hampshire US REIT (42.1%)
    • Elite Commercial REIT (41.9%)

Market Capitalisation Overview

  • Total Singapore REIT Market Capitalisation decreased by 0.3% to S$96.23 Billion.
    • Decreased from S$96.52 Billion in October 2022.
  • Biggest Market Capitalisation REITs:
    • Capitaland Integrated Commercial Trust ($3.52B)
    • Ascendas REIT ($11.59B)
    • Mapletree Pan Asia Commercial Trust ($8.64B)
    • Mapletree Logistics Trust ($7.73B)
    • Mapletree Industrial Trust ($6.22B)
    • Frasers Logistics & Commercial Trust ($4.36B)
    • No change in the rankings since September 2022.
  • Smallest Market Capitalisation REITs:
    • Lippo Malls Indonesia Retail Trust ($239M)
    • BHG Retail REIT ($257M)
    • ARA Hospitality Trust ($289M)
    • EC World REIT ($368M)
    • United Hampshire US REIT ($384M)
    • Elite Commercial REIT ($392M)

Disclaimer: The above table is best used for “screening and shortlisting only”. It is NOT for investing (Buy / Sell) decision. If you want to know more about investing in REITs, here’s a subsidised 2-day course with all you need to know about REITs and how to start investing in them.


Top 20 Worst Performers of the Month in October 2022


 (Source: https://stocks.cafe/kenny/advanced)


SG 10 Year & US 10 Year Government Bond Yield

  • SG 10 Year: 3.48% (decreased from 3.49%)
  • US 10 Year: 3.82% (decreased from 3.84%)


Major REIT News in October 2022


S-REITs Earnings Season for the Period Ending 30 Sep 2022 has wrapped up

All S-REITs have finished reporting their earnings. Of the 16 REITs who reported their earnings for Q1 and/or Q2 (taking most recent DPU) (excl. DC REIT), the overview on Q-o-Q or H-o-H DPU change are as follows:

4 REITs have reported an increase in DPU,

3 REITs have reported no change in DPU, and

9 REITs have reported a decrease in DPU.


Summary


Fundamentally, the whole Singapore REITs landscape is very undervalued based on the average Price/NAV (at 0.81) value of the S-REITs, which is quite rare that S-REIT is trading at such huge discount with a very attractive DPU yield of 7.58%! This is even higher than as of last month. Below is the market cap heat map for the past 1 month. The performance of REITs are evenly split. 18 REITs have been bullish while 17 REITs have been bearish the last 30 days. There is no clear correlation with market cap in terms of performance.


(Source: https://stocks.cafe/kenny/overview)

Yield spread (in reference to the 10-year Singapore government bond yield of 3.48% as of 11th November 2022) widened from 3.76% to 4.17%. This is a huge increase of 0.41%. The S-REIT Average Yield increased from 7.30% to 7.58%. Government Bond Yields remained relatively unchanged. This resulted in the widening of the yield spread. 

Technically, FTSE ST REIT Index is currently in a bearish territory but rebounded strongly from the support level. Based on the past chart patterns, REIT Index used to have a strong V-shaped rebound when there was a huge sell off with a very attractive valuation & DPU yield. Will the history repeat itself and can the S-REIT Index stage a strong rebound from this level? It remains to be seen. However, the Reward/Risk Ratio look quite attractive both fundamentally and technically. Investors can start to do some bottom fishing on the fundamentally strong REITs by locking in the current share price and high DPU yield.


Note: This above analysis is for my own personal research and it is NOT a buy or sell recommendation. Investors who would like to leverage my extensive research and years of Singapore REIT investing experience can approach me separately for a REIT Portfolio Consultation.

Kenny Loh is an Associate Wealth Advisory Director and REITs Specialist of Singapore’s top Independent Financial Advisor. He helps clients construct diversified portfolios consisting of different asset classes from REITs, Equities, Bonds, ETFs, Unit Trusts, Private Equity, Alternative Investments, Digital Assets and Fixed Maturity Funds to achieve an optimal risk adjusted return. Kenny is also a CERTIFIED FINANCIAL PLANNER, SGX Academy REIT Trainer, Certified IBF Trainer of Associate REIT Investment Advisor (ARIA) and also invited speaker of REITs Symposium and Invest Fair.  You can join my Telegram channel #REITirement – SREIT Singapore REIT Market Update and Retirement related news. https://t.me/REITirement

Continue ReadingSingapore REIT Monthly Update (November 13th 2022)