Money and Me: US Office Reits – the immediate outlook is bleak but there are opportunities for investors
We take a closer look at the deterioration of the pure play US office Reit sector. With the US Fed interest rate path as vague as ever, which companies are likely to struggle and can investors find attractive opportunities? Michelle Martin asks Kenny Loh, REIT Specialist and Independent Financial Advisor.
Note: The above analysis are my own personal views and are NOT buy or sell recommendations. Investors who would like to leverage my extensive research and years of Singapore REIT investing experience can approach me separately for a REIT Portfolio Consultation.
Listen to his previous market outlook interviews here:
Kenny Loh is an Associate Wealth Advisory Director and REITs Specialist of Singapore’s top Independent Financial Advisor. He helps clients construct diversified portfolios consisting of different asset classes from REITs, Equities, Bonds, ETFs, Unit Trusts, Private Equity, Alternative Investments, Digital Assets and Fixed Maturity Funds to achieve an optimal risk adjusted return. Kenny is also a CERTIFIED FINANCIAL PLANNER, SGX Academy REIT Trainer, Certified IBF Trainer of Associate REIT Investment Advisor (ARIA) and also invited speaker of REITs Symposium and Invest Fair.
Technical Analysis of FTSE ST REIT Index (FSTAS351020)
FTSE ST Real Estate Investment Trusts (FTSE ST REIT Index) increased from 712.46 to 676.08 (-5.11%) compared to last month’s update. The REIT index is now in a downward parallel channel, with the 200D SMA being the immediate resistance, followed by the 739 as the next resistance.
Short-term direction: Down
Medium-term direction: Sideways
Long-term direction: Sideways
Immediate Support at 662 (previous low in Oct 2022)
The following is the compilation of 38 Singapore REITs with colour-coding of the Distribution Yield, Gearing Ratio and Price to NAV Ratio.
The Financial Ratios are based on past data and these are lagging indicators.
REITs highlighted in cyan have the latest Q4 2023 update values, the rest have Q3 update values.
I have introduced weighted average (weighted by market cap) to the financial ratios, in addition to the existing simple average ratios. This is another perspective where smaller market cap REITs do not disproportionately affect the average ratios.
FY DPU: If Green, FY DPU for the recent 4 Quarters is higher than that of the preceding 4 Quarters.If Lower, it isRed.
Yield (ttm): Yield, calculated by DPU (trailing twelve months) and Current Price as of February 9th, 2023.
Gearing (%): Leverage Ratio.
Price/NAV: Price to Book Value. Formula: Current Price over Net Asset Value per Unit.
Yield Spread (%): REIT yield (ttm) reference to Gov Bond Yields. REITs trading in USD is referenced to US Gov Bond Yield, everything else is referenced to SG Gov Bond Yield.
Price/NAV Ratios Overview
Price/NAV decreased to 0.75(Weighted Average: 0.75)
Decreased from 0.79 in January 2023.
Singapore Overall REIT sector is very undervalued now.
Take note that NAV is adjusted upwards for some REITs due to pandemic recovery.
Most overvalued REITs (based on Price/NAV)
ParkwayLife REIT
1.53
Mapletree Industrial Tr
1.29
Keppel DC REIT
1.28
Capitaland Ascendas REIT
1.23
Mapletree Logistics Tr
1.08
Frasers Centrepoint Trust
0.97
Only 5 REITs are overvalued now based on Price/NAV value.
After 9 months of reigning in the Top 2, Mapletree Industrial Trust has taken Keppel DC REIT’s place.
Most undervalued REITs (based on Price/NAV)
Manulife US REIT
0.18
Lippo Malls Indonesia Retail Trust
0.19
Prime US REIT
0.21
Keppel Pacific Oak US REIT
0.31
ARA Hospitality Trust
0.37
EC World REIT
0.40
Distribution Yields Overview
TTM Distribution Yield decreased to 8.21%. (Weighted Average is 6.32%)
Decreased from 8.35% in January 2023. (Weighted Average was 6.16%)
19 of 40 Singapore REITs have ttm distribution yields of above 7%.
Do take note that these yield numbers are based on current prices taking into account the delayed distribution/dividend cuts due to COVID-19, and economic recovery.
Some REITs opted for semi-annual reporting and thus no quarterly DPU was announced.
A High Yield should not be the sole ratio to look for when choosing a REIT to invest in.
Yield Spread tightened to 5.07%. (Weighted Average widened slightly to 3.85%)
Tightened from 5.40% in January 2023. (Weighted Average was 3.80%)
Gearing Ratios Overview
Gearing Ratio decreased to 38.06%. (Weighted Average: 37.86%)
Decreased from 38.16% of January 2023. (Weighted Average: 38.38%)
Gearing Ratios are updated quarterly.
S-REITs Gearing Ratio has been on a steady uptrend. It was 35.55% in Q4 2019.
Highest Gearing Ratio REITs
Manulife US REIT
58.3
Elite Commercial REIT
45.4
Prime US REIT
43.7
Lippo Malls Indonesia Retail Trust
43.0
Suntec REIT
42.3
United Hampshire REIT
41.7
Manulife’s gearing ratio has exceeded MAS’s gearing limit of 50%. In last month’s Money and Me episode, we discussed why has the proposal to rescue Manulife US REIT fallen flat, and can Manulife US REIT be saved. Listen to it here.
Market Capitalisation Overview
Total Singapore REIT Market Capitalisation decreased by 7.51% to S$90.08 Billion.
Decreased from S$97.46 Billion in January 2023.
Biggest Market Capitalisation REITs (S$):
Capitaland Integrated Commercial Trust
13233.50
Capitaland Ascendas REIT
11826.00
Mapletree Logistics Tr
7504.70
Mapletree Pan Asia Commercial Trust
7297.50
Mapletree Industrial Tr
6735.40
Frasers Logistics & Commercial Trust
4114.00
There are no change in the rankings since November 2022.
Smallest Market Capitalisation REITs (S$):
Manulife US REIT
110.40
Lippo Malls Indonesia Retail Trust
115.50
Elite Commercial REIT
130.40
ARA Hospitality Trust
164.79
Prime US REIT
190.40
EC World REIT
226.76
Disclaimer: The above table is best used for “screening and shortlisting only”. It is NOT for investing (Buy / Sell) decision. If you want to know more about investing in REITs, scroll down for more information on the REITs courses.
The past month was a bearish month for S-REITs again which possibly caused by the increase in US 10 Years Gov Bond Yields (highly inversely correlated with FTSE ST REIT Index in 2023) and poor earnings release by most of the REITs (which DPU was expected to drop YoY due to the full impact of interest rate). Fundamentally, the whole Singapore REITs landscape remains undervalued based on the average Price/NAV (at 0.75) value of the S-REITs, with still a very attractive DPU yield of 8.35%! (Weighted average yield of 6.32%). Do take note that NAV and DPU are lagging numbers.
FTSE ST REIT Index vs 10 Year US Gov Bond YieldFTSE S-REIT’s Inverse Correlation with 10Y US Gov Bond Yield
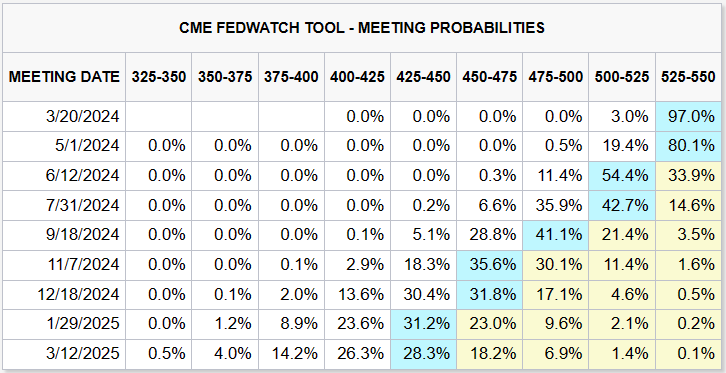
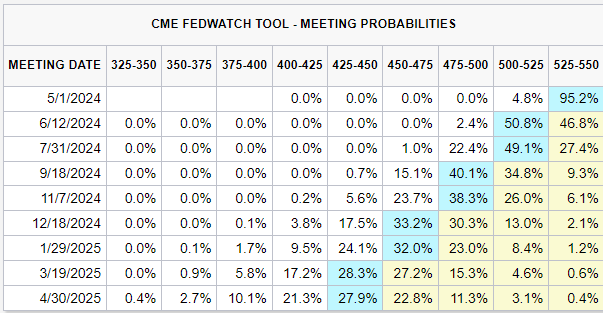
Weighted Average Yield spread (in reference to the 10-year Singapore government bond yield of 2.98% as of 10th February 2023) widened slightly from 3.80% to 3.85%.Based on the CME group’s interest rate futures, there will be a high possibility of rate cut of between 100-150 bps by end of 2024.
Technically the FTSE ST REIT index is expected to be range bound between 739 to 662 until a clear breakout. The next FOMC meeting on Mar 20-2024 would be the key date REIT investors should be looking forward to.
Want to know more about the REITs market outlook for 2024? Want to gain insights into subsector performances, management strategies for navigating macro challengesand risks to watch when venturing overseas for REITs? Watch my interview “REIT Outlook: Pro Forecasts, Strategies and Picks for 2024″ with the Financial Coconut now!
Courses: Financial Ratio Analysis and Technical Analysis for REITs with SGX Academy
On 2 Saturdays in March (2nd and 9th), I will be conducting 2 courses, for you to get a head start in understanding Singapore REITs. These will be hands-on courses, where I will guide you step-by-step in performing the course content proficiently. This is a very good time to enter!
Financial Ratio Analysis for Singapore REITS (2nd March 2024, 9am to 1pm)
You will learn how to:
Learn how to assess the financial health of Singapore REITs by analyzing key ratios
Identifying financial strengths and weaknesses, enabling them to make informed investment decisions
Interpret ratios and understand what are the operation factors which can affect the ratio in future
Learn how to use valuation ratios to determine the fair value of Singapore REITs and assess their sustainability.
Identify undervalued or overvalued REITs, aiding them in making sound investment choices.
Kenny Loh is a Wealth Advisory Director and REITs Specialist of Singapore’s top Independent Financial Advisor. He helps clients construct diversified portfolios consisting of different asset classes from REITs, Equities, Bonds, ETFs, Unit Trusts, Private Equity, Alternative Investments, Digital Assets and Fixed Maturity Funds to achieve an optimal risk adjusted return. Kenny is also a CERTIFIED FINANCIAL PLANNER, SGX Academy REIT Trainer, Certified IBF Trainer of Associate REIT Investment Advisor (ARIA) and also invited speaker of REITs Symposium and Invest Fair. You can join my Telegram channel #REITirement – SREIT Singapore REIT Market Update and Retirement related news. https://t.me/REITirement
Technical Analysis of FTSE ST REIT Index (FSTAS351020)
FTSE ST Real Estate Investment Trusts (FTSE ST REIT Index) increased from 686.24 to 712.46 (3.82%)compared to last month’s update. The REIT Index is trading within an uptrend parallel channel (purple), above the 200D SMA support. The Moving Averages have reversed from down trend to uptrend.
The following is the compilation of 38 Singapore REITs with colour-coding of the Distribution Yield, Gearing Ratio and Price to NAV Ratio.
The Financial Ratios are based on past data and these are lagging indicators.
All REITs have the latest Q3 2023 update values.
I have introduced weighted average (weighted by market cap) to the financial ratios, in addition to the existing simple average ratios. This is another perspective where smaller market cap REITs do not disproportionately affect the average ratios.
FY DPU: If Green, FY DPU for the recent 4 Quarters is higher than that of the preceding 4 Quarters.If Lower, it isRed.
Yield (ttm): Yield, calculated by DPU (trailing twelve months) and Current Price as of January 5th, 2023. Notes:
ESR-LOGOS REIT and Paragon REIT: Annualised yield, after taking into account switch to semi-annual distribution declaration. For Paragon REIT: calculated after converting from 13 months of distribution to 12 months.
Gearing (%): Leverage Ratio.
Price/NAV: Price to Book Value. Formula: Current Price over Net Asset Value per Unit.
Yield Spread (%): REIT yield (ttm) reference to Gov Bond Yields. REITs trading in USD is referenced to US Gov Bond Yield, everything else is referenced to SG Gov Bond Yield.
Price/NAV Ratios Overview
Price/NAV increased to 0.79 (Weighted Average: 0.79)
Increased from 0.76 in December 2023.
Singapore Overall REIT sector is very undervalued now.
Take note that NAV is adjusted upwards for some REITs due to pandemic recovery.
Most overvalued REITs (based on Price/NAV)
ParkwayLife REIT
1.60
Keppel DC REIT
1.35
Mapletree Industrial Tr
1.32
Capitaland Ascendas REIT
1.27
Mapletree Logistics Tr
1.18
AIMS APAC REIT
0.99
Only 5 REITs are overvalued now based on Price/NAV value.
No change in the Top 2 in the last 8 months.
Most undervalued REITs (based on Price/NAV)
Lippo Malls Indonesia Retail Trust
0.19
Manulife US REIT
0.20
Prime US REIT
0.29
ARA Hospitality Trust
0.39
EC World REIT
0.40
Keppel Pacific Oak US REIT
0.42
Distribution Yields Overview
TTM Distribution Yield decreased to 8.35%. (Weighted Average is 6.16%)
Decreased from 8.83% in December 2023 (Weighted Average was 6.46%)
19 of 40 Singapore REITs have ttm distribution yields of above 7%.
Do take note that these yield numbers are based on current prices taking into account the delayed distribution/dividend cuts due to COVID-19, and economic recovery.
8 REITs have a ttm yield of over 10%!
Highest Distribution Yield REITs (ttm)
Manulife US REIT
27.44
Prime US REIT
25.53
Keppel Pacific Oak US REIT
15.53
Elite Commercial REIT
13.96
EC World REIT
12.85
United Hampshire REIT
11.76
Reminder that these yield numbers are based on current prices. This has caused Manulife US REIT and Prime US REIT’s ttm yields to be over 25%.
Some REITs opted for semi-annual reporting and thus no quarterly DPU was announced.
A High Yield should not be the sole ratio to look for when choosing a REIT to invest in.
Yield Spread tightened to 5.40%. (Weighted Average tightened to 3.80%)
Tightened from 5.77% in December 2023. (Weighted Average was 4.39%)
Gearing Ratios Overview
Gearing Ratio remained at 38.16%.(Weighted Average: 38.38%)
Remained at 38.16% of December 2023. (Weighted Average: 38.38%)
Gearing Ratios are updated quarterly. No REITs have updated their gearing ratios for this month.
S-REITs Gearing Ratio has been on a steady uptrend. It was 35.55% in Q4 2019.
Highest Gearing Ratio REITs
Manulife US REIT
56.0
Elite Commercial REIT
45.4
Prime US REIT
43.7
Lippo Malls Indonesia Retail Trust
43.0
Suntec REIT
42.7
Capitaland China Trust
42.4
Manulife’s gearing ratio has exceeded MAS’s gearing limit of 50%. In last month’s Money and Me episode, we discussed why has the proposal to rescue Manulife US REIT fallen flat, and can Manulife US REIT be saved. Listen to it here.
Market Capitalisation Overview
Total Singapore REIT Market Capitalisation increased by 5.47% to S$97.462 Billion.
Increased from S$92.40 Billion in December 2023.
Biggest Market Capitalisation REITs (S$):
Capitaland Integrated Commercial Trust
13315.45
Capitaland Ascendas REIT
13002.90
Mapletree Logistics Tr
8518.98
Mapletree Pan Asia Commercial Trust
8084.63
Mapletree Industrial Tr
7085.00
Frasers Logistics & Commercial Trust
4268.77
There are no change in the rankings since November 2022.
Smallest Market Capitalisation REITs (S$):
Lippo Malls Indonesia Retail Trust
107.76
Manulife US REIT
189.13
EC World REIT
226.75
Elite Commercial REIT
232.46
ARA Hospitality Trust
237.97
BHG Retail REIT
241.62
Disclaimer: The above table is best used for “screening and shortlisting only”. It is NOT for investing (Buy / Sell) decision. If you want to know more about investing in REITs, here’s a subsidised 2-day course with all you need to know about REITs and how to start investing in them.
The past month has been a bullish month for S-REITs, finally! Firstly, the drop in the 10 years government bond yields have continued. The announcement of further rate cuts projected for 2024 have also helped. Fundamentally, the whole Singapore REITs landscape remains undervalued based on the average Price/NAV (at 0.79) value of the S-REITs, with still a very attractive DPU yield of 8.35%!(Weighted average yield of 6.16%). Do take note that NAV and DPU are lagging numbers.
Weighted Average Yield spread (in reference to the 10-year Singapore government bond yield of 2.78% as of 10th December 2023) narrowed from 4.39% to 3.80%. The Fed Rate has further adjusted its forecast lower. The image below shows the new forecast.
Want to know more about the REITs market outlook for 2024? Want to gain insights into subsector performances, management strategies for navigating macro challengesand risks to watch when venturing overseas for REITs? Watch my interview “REIT Outlook: Pro Forecasts, Strategies and Picks for 2024″ with the Financial Coconut now!
Seminar: Singapore REITs Outlook: What’s ahead for 2024 – SGX Academy (Free Registration)
Rising interest rates have impacted global REITs over the past 2 years. Are rates expected to peak in 2024? Will this create an opportunity for a recovery in the REITs sector? Secure your seat for this exclusive in-person event to find out! Join us as industry experts unravel trends, challenges, and opportunities shaping Singapore’s REIT landscape in 2024. Delve into key topics such as sector performances, macroeconomic influences, and industry insights. Also engage in discussions, gain insights, and network with fellow investors and industry experts.
You will gain insights on:
Sector Resilience Amid Economic Recovery: Discover how Singapore REITs are positioned for the year ahead. Explore insights into the resilience of different REIT sectors, identifying those that are well-positioned to ride varying market conditions.
Navigating Risk and Opportunity: Gain strategies to navigate the intricate balance of risks and opportunities within the sector. Understand how to assess risk factors going into 2024 and learn to identify investment opportunities that align with the broader economic recovery.
Event Details:
Date & Time: 27th January 2024, 10:00am – 1:00pm Registration opens at 9:30am
Location: SGX Auditorium, Level 2, SGX Centre 1, 2 Shenton Way Singapore 068804
Dress Code: Smart Casual
Admission is free. Registration is required. Register Now!
Speakers
Programme
Kenny Loh is a Wealth Advisory Director and REITs Specialist of Singapore’s top Independent Financial Advisor. He helps clients construct diversified portfolios consisting of different asset classes from REITs, Equities, Bonds, ETFs, Unit Trusts, Private Equity, Alternative Investments, Digital Assets and Fixed Maturity Funds to achieve an optimal risk adjusted return. Kenny is also a CERTIFIED FINANCIAL PLANNER, SGX Academy REIT Trainer, Certified IBF Trainer of Associate REIT Investment Advisor (ARIA) and also invited speaker of REITs Symposium and Invest Fair. You can join my Telegram channel #REITirement – SREIT Singapore REIT Market Update and Retirement related news. https://t.me/REITirement