Singapore REITs Monthly Update (December 10th, 2024)

  • Post author:

Technical Analysis of FTSE ST REIT Index (FSTAS351020)


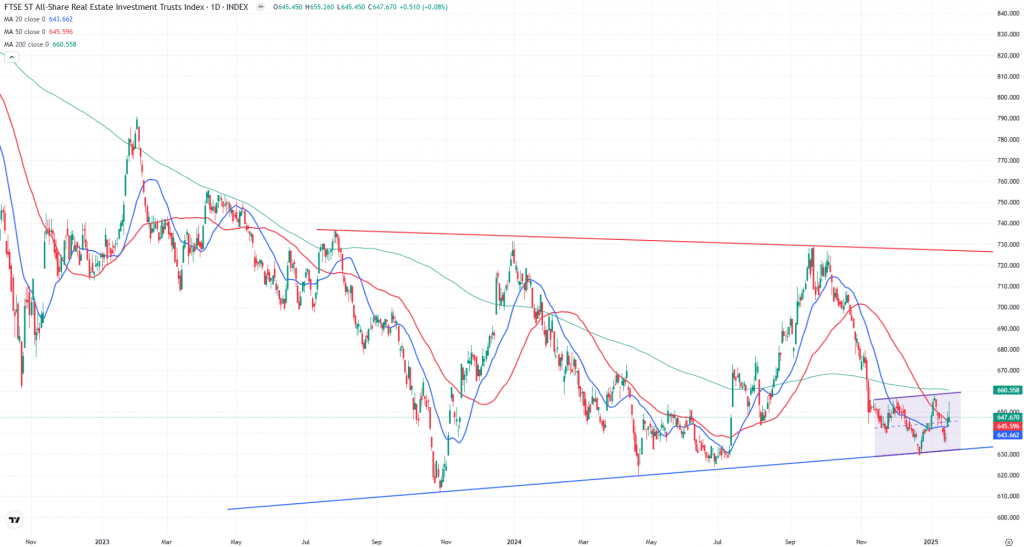
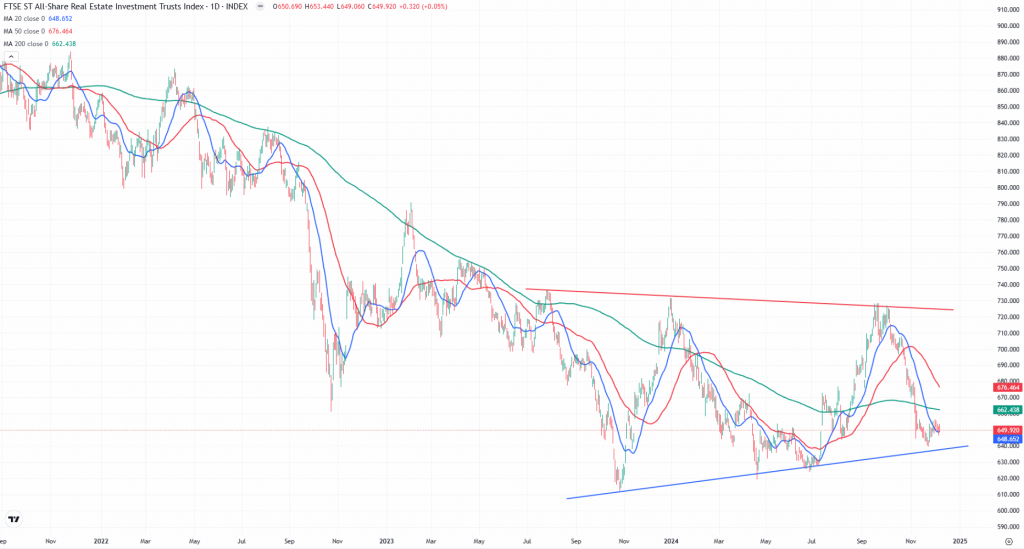
FTSE ST Real Estate Investment Trusts (FTSE ST REIT Index) decreased from 649.94 to 642.87 (-1.09%) compared to last month’s update. Singapore REITs index is currently trading near the support level of a wedge pattern.

  • Short-term direction: Sideways
  • Medium-term direction: Sideways
  • Long-term direction: Sideways
  • Immediate Support: Blue Support Line (Wedge)
  • Immediate Resistance: Red resistance line (Wedge)

FTSE REIT Index Chart (2 years)

Previous chart on FTSE ST REIT index can be found in the last post: Singapore REIT Fundamental Comparison Table on November 10th, 2024.

Fundamental Analysis of 38 Singapore REITs


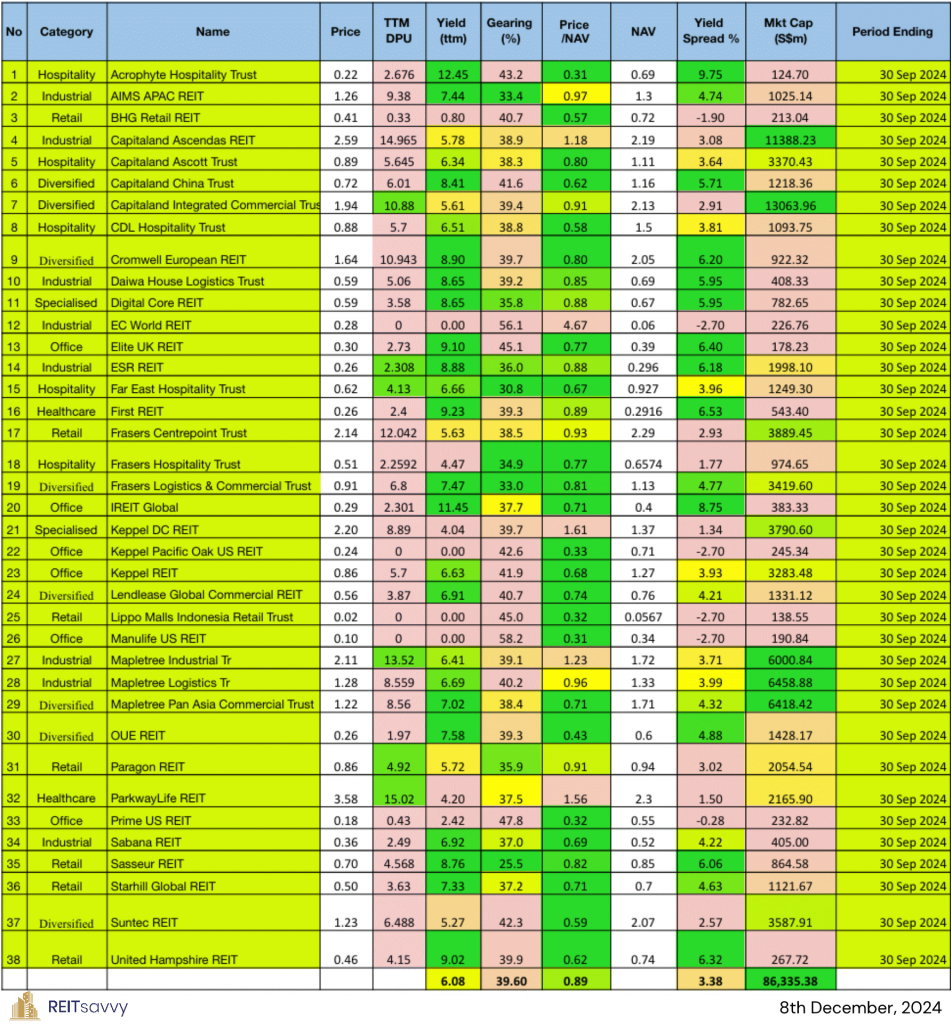
The following is the compilation of 38 Singapore REITs with colour-coding of the Distribution Yield, Gearing Ratio and Price to NAV Ratio.

  • The Financial Ratios are based on past data and these are lagging indicators.
  • All REITs have the latest Q3 2024 values.
  • I have introduced weighted average (weighted by market cap) to the financial ratios, in addition to the existing simple average ratios. This is another perspective where smaller market cap REITs do not disproportionately affect the average ratios.

Data from REITsavvy Screener. https://screener.reitsavvy.com/
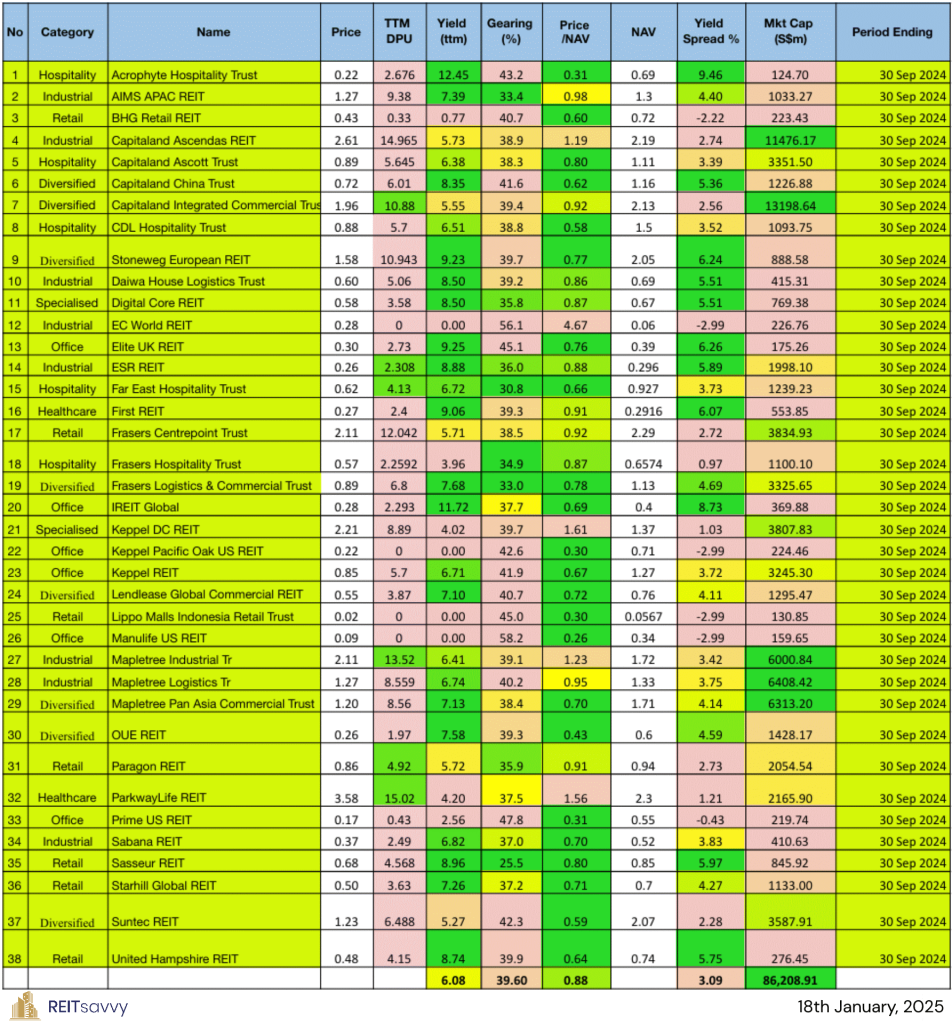
What does each Column mean?

  • FY DPU: If Green, FY DPU for the recent 4 Quarters is higher than that of the preceding 4 Quarters. If Lower, it is Red.
  • Yield (ttm): Yield, calculated by DPU (trailing twelve months) and Current Price as of December 6th, 2024.
  • Gearing (%): Leverage Ratio.
  • Price/NAV: Price to Book Value. Formula: Current Price over Net Asset Value per Unit.
  • Yield Spread (%): REIT yield (ttm) reference to Gov Bond Yields. REITs are referenced to SG Gov Bond Yield.

As of May 2024, all REITs’ Yield Spread will be referenced to SG Gov Bond Yields, regardless of trading currency.

Price/NAV Ratios Overview

  • Price/NAV increased to 0.89 (Weighted Average: 0.89)
    • Increased from 0.87 in November 2024.
    • Singapore Overall REIT sector is slightly undervalued
  • Most overvalued REITs (based on Price/NAV)
    Keppel DC REIT 1.61
    ParkwayLife REIT 1.56
    Mapletree Industrial Tr 1.23
    Capitaland Ascendas REIT 1.18
    AIMS APAC REIT 0.97
    Mapletree Logistics Tr 0.96

    EC World REIT is currently suspended, however at current Price and NAV/Unit values it has a value of 4.67 (N.M)

  • Most undervalued REITs (based on Price/NAV)
    Manulife US REIT 0.31
    Acrophyte Hospitality Trust 0.31
    Lippo Malls Indonesia Retail Trust 0.32
    Prime US REIT 0.32
    Keppel Pacific Oak US REIT 0.33
    OUE REIT 0.43

Distribution Yields Overview

  • TTM Distribution Yield decreased to 6.08%. (Weighted Average decreased to 6.19%)    
    • Decreased from 6.50% in November 2024. (Weighted Average was 6.25%)
    • 16 of 38 Singapore REITs have ttm distribution yields of above 7%.
  • Highest Distribution Yield REITs (ttm)
    Acrophyte Hospitality Trust 12.45
    IREIT Global 11.46
    First REIT 9.23
    Elite UK REIT 9.10
    United Hampshire REIT 9.02
    Cromwell European REIT 8.90

    Reminder that these yield numbers are based on current prices. 

    • Some REITs opted for semi-annual reporting and thus no quarterly DPU was announced.
    • A High Yield should not be the sole ratio to look for when choosing a REIT to invest in.
  • Yield Spread tightened to 3.38%. (Weighted Average remained similar at 4.01%)     
    • Tightened from 3.69% in November 2024. (Weighted Average was 4.02%)
    • From May 2024 onwards, all my yield spread measurements are now in relation to SG Gov Bond Yields, no longer a mix with US Gov Bond Yields.


Gearing Ratios Overview

  • Gearing Ratio decreased to 39.60%. (Weighted Average: 38.76%)
    • Decreased from 39.74% in November 2024. (Weighted Average: 38.69%)  
    • Gearing Ratios are updated quarterly.
    • S-REITs Gearing Ratio has been on a steady uptrend. It was 35.55% in Q4 2019.
  • Highest Gearing Ratio REITs
    Manulife US REIT 58.2
    EC World REIT 56.1
    Prime US REIT 47.8
    Elite UK REIT 45.1
    Lippo Malls Indonesia Retail Trust 45.0
    Acrophyte Hospitality Trust 43.2

    MUST and EC World REIT’s gearing ratio has exceeded MAS’s gearing limit of 50%. However, the aggregate leverage limit is not considered to be breached if exceeding the limit is due to circumstances beyond the control of the REIT Manager.

Market Capitalisation Overview

  • Total Singapore REIT Market Capitalisation decreased by 0.50% to S$86.34 Billion.
    • Decreased from S$86.77 Billion in November 2024.
  • Biggest Market Capitalisation REITs (S$m):
    Capitaland Integrated Commercial Trust 13,063.96
    Capitaland Ascendas REIT 11,388.23
    Mapletree Logistics Tr 6,458.88
    Mapletree Pan Asia Commercial Trust 6,418.42
    Mapletree Industrial Tr 6,000.84
    Frasers Centrepoint Trust 3,889.45
  • Smallest Market Capitalisation REITs (S$m):
    Acrophyte Hospitality Trust 124.70
    Lippo Malls Indonesia Retail Trust 138.55
    Elite UK REIT 178.23
    Manulife US REIT 190.84
    BHG Retail REIT 213.04
    EC World REIT 226.76

Disclaimer: The above table is best used for “screening and shortlisting only”. It is NOT for investing (Buy / Sell) decision. If you want to know more about investing in REITs, scroll down for more information on the REITs courses.

Top 20 Best/Worst Performers of November 2024


Source: https://screener.reitsavvy.com/

SG 10 Year Government Bond Yield

  • SG 10 Year: 2.70% (decreased from 2.82%)


Summary


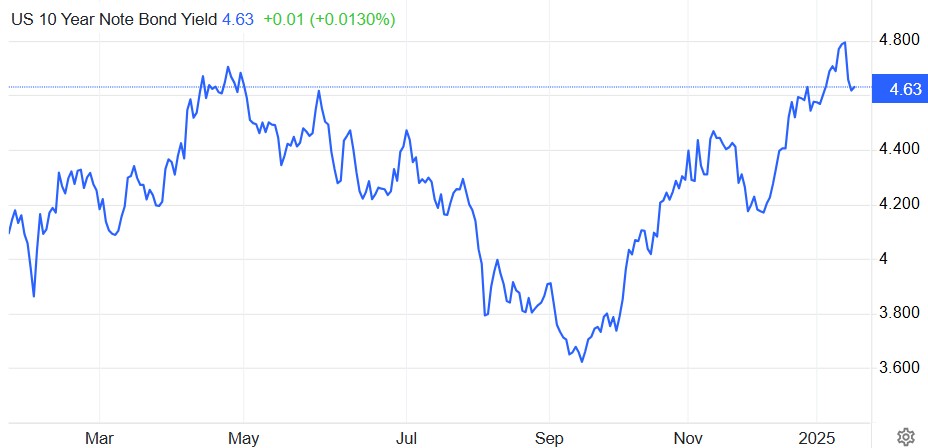
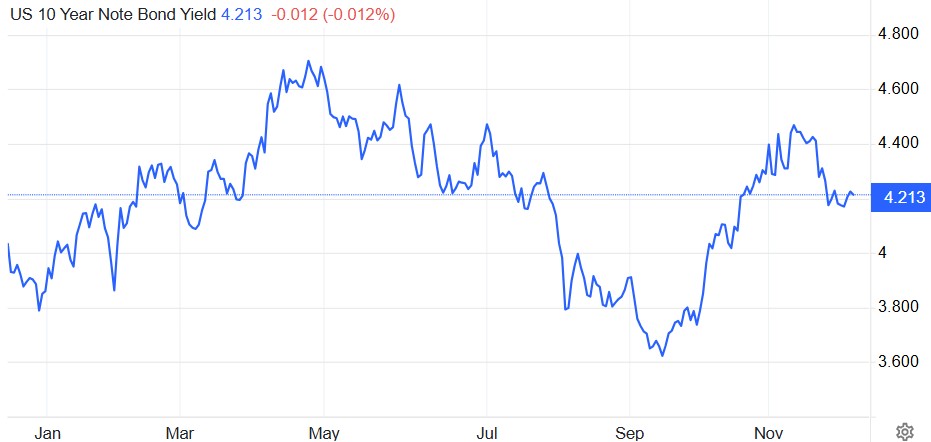
Singapore REITs has temporarily paused at current level (near the support based on chart pattern). At the same time, US 10 years risk free rate has broken out from an uptrend channel and showing sign of trend reversal.


US 10 Year Risk Free Rate

Fundamentally, the S-REIT sector is trading at a 11% discount to its fair value, with an average trailing twelve-month (TTM) yield of 6.08%. 

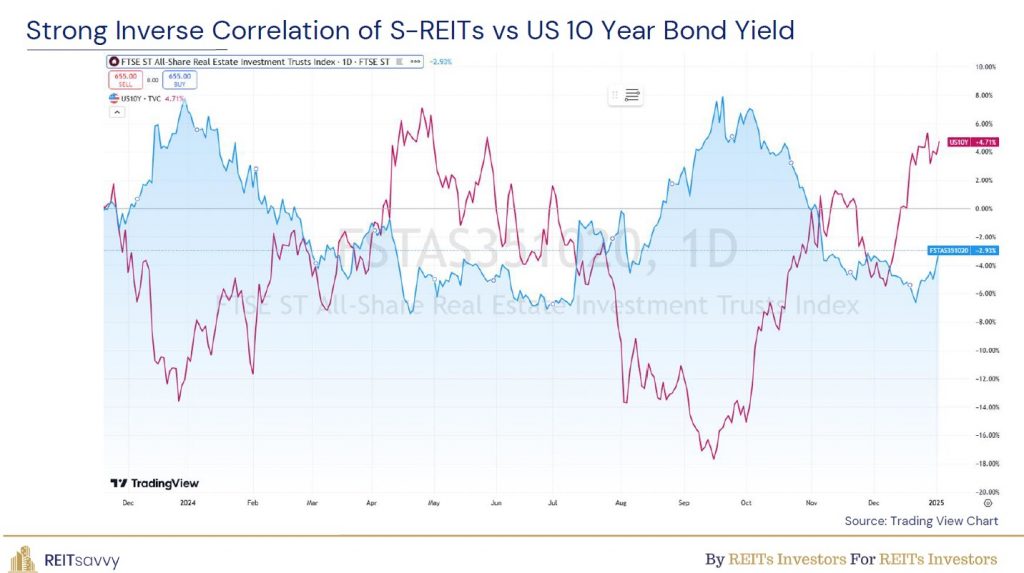
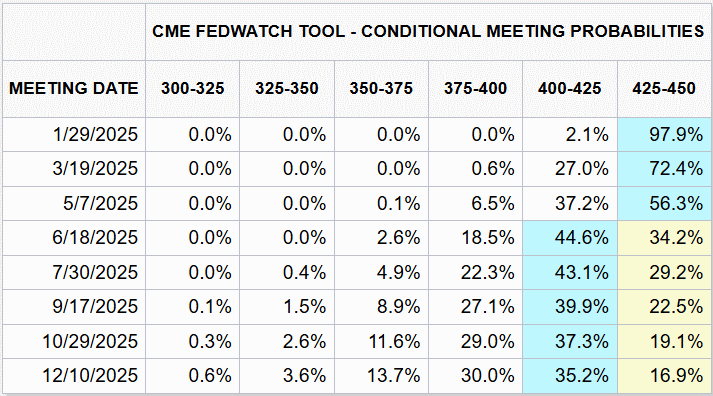
According to the current Fed Fund Rate projections from the CME Group, the market expect another 25 basis point cut by end 2024, with a total reduction of 100 basis points cut from the peak of the interest rate cycle. The cut in interest rate will help to boost the DPU of the REITs which have shorter debt maturity profile and higher percentage of floating rate. However, the impact will only be reflected in the financial statement of the next 1 to 2 quarter. The current weakness of the S-REIT sector will continue to be shadowed by the US 10 Year Risk Free rate which have has very strong inversed correlation with the REIT index.


Kenny Loh is a distinguished Wealth Advisory Director with a specialization in holistic investment planning and estate management. He excels in assisting clients to grow their investment capital and establish passive income streams for retirement. Kenny also facilitates tax-efficient portfolio transfers to beneficiaries, ensuring tax-efficient capital appreciation through risk mitigation approaches and optimized wealth transfer through strategic asset structuring.

In addition to his advisory role, Kenny is an esteemed SGX Academy trainer specializing in S-REIT investing and regularly shares his insights on MoneyFM 89.3. He holds the titles of Certified Estate & Legacy Planning Consultant and CERTIFIED FINANCIAL PLANNER (CFP).

With over a decade of experience in holistic estate planning, Kenny employs a unique “3-in-1 Will, LPA, and Standby Trust” solution to address clients’ social considerations, legal obligations, emotional needs, and family harmony. He holds double master’s degrees in Business Administration and Electrical Engineering, and is an Associate Estate Planning Practitioner (AEPP), a designation jointly awarded by The Society of Will Writers & Estate Planning Practitioners (SWWEPP) of the United Kingdom and Estate Planning Practitioner Limited (EPPL), the accreditation body for Asia.

 You can join his Telegram channel #REITirement – SREIT Singapore REIT Market Update and Retirement related news. https://t.me/REITirement
Continue ReadingSingapore REITs Monthly Update (December 10th, 2024)

Singapore REITs Monthly Update (November 10th, 2024)

  • Post author:

Technical Analysis of FTSE ST REIT Index (FSTAS351020)


FTSE ST Real Estate Investment Trusts (FTSE ST REIT Index) decreased from 700.03 to 649.94 (-7.15%) compared to last month’s update. Singapore REITs is currently going through a correction, moving towards a  support zone at about 630-640.

  • Short-term direction: Down
  • Medium-term direction: Down
  • Long-term direction: Sideways
  • Immediate Support: Blue Support Line
  • Immediate Resistance: 200D SMA

FTSE REIT Index Chart (2 years)

Previous chart on FTSE ST REIT index can be found in the last post: Singapore REIT Fundamental Comparison Table on October 12th, 2024.

Fundamental Analysis of 38 Singapore REITs


The following is the compilation of 38 Singapore REITs with colour-coding of the Distribution Yield, Gearing Ratio and Price to NAV Ratio.

  • The Financial Ratios are based on past data and these are lagging indicators.
  • All REITs have the latest Q2 2024 values.
  • I have introduced weighted average (weighted by market cap) to the financial ratios, in addition to the existing simple average ratios. This is another perspective where smaller market cap REITs do not disproportionately affect the average ratios.

Data from REITsavvy Screener. https://screener.reitsavvy.com/


What does each Column mean?

  • FY DPU: If Green, FY DPU for the recent 4 Quarters is higher than that of the preceding 4 Quarters. If Lower, it is Red.
  • Yield (ttm): Yield, calculated by DPU (trailing twelve months) and Current Price as of November 9th, 2024.
  • Gearing (%): Leverage Ratio.
  • Price/NAV: Price to Book Value. Formula: Current Price over Net Asset Value per Unit.
  • Yield Spread (%): REIT yield (ttm) reference to Gov Bond Yields. REITs are referenced to SG Gov Bond Yield.

As of May 2024, all REITs’ Yield Spread will be referenced to SG Gov Bond Yields, regardless of trading currency.

Price/NAV Ratios Overview

  • Price/NAV decreased to 0.87 (Weighted Average: 0.87)
    • Decreased from 0.91 in October 2024.
    • Singapore Overall REIT sector is slightly undervalued
  • Most overvalued REITs (based on Price/NAV)
    Keppel DC REIT 1.58
    ParkwayLife REIT 1.56
    Mapletree Industrial Tr 1.23
    Capitaland Ascendas REIT 1.19
    AIMS APAC REIT 0.97
    Mapletree Logistics Tr 0.96

    EC World REIT is currently suspended, however at current Price and NAV/Unit values it has a value of 4.67 (N.M)

  • Most undervalued REITs (based on Price/NAV)
    Manulife US REIT 0.29
    Prime US REIT 0.30
    Acrophyte Hospitality Trust 0.31
    Keppel Pacific Oak US REIT 0.32
    Lippo Malls Indonesia Retail Trust 0.39
    OUE REIT 0.43

Distribution Yields Overview

  • TTM Distribution Yield increased to 6.50%. (Weighted Average increased to 6.25%)    
    • Increased from 6.23% in October 2024. (Weighted Average was 5.91%)
    • 15 of 38 Singapore REITs have ttm distribution yields of above 7%.
  • Highest Distribution Yield REITs (ttm)
    Acrophyte Hospitality Trust 12.45
    IREIT Global 11.49
    EC World REIT 9.24
    First REIT 9.23
    Elite UK REIT 9.10
    Cromwell European REIT 9.01

    Reminder that these yield numbers are based on current prices. 

    • Some REITs opted for semi-annual reporting and thus no quarterly DPU was announced.
    • A High Yield should not be the sole ratio to look for when choosing a REIT to invest in.
  • Yield Spread widened to 3.69%. (Weighted Average remained similar at 4.02%)     
    • Widened from 3.40% in October 2024. (Weighted Average was 4.01%)
    • From May 2024 onwards, all my yield spread measurements are now in relation to SG Gov Bond Yields, no longer a mix with US Gov Bond Yields.


Gearing Ratios Overview

  • Gearing Ratio increased to 39.74%. (Weighted Average: 38.69%)
    • Increased from 39.12% in October 2024. (Weighted Average: 38.28%)  
    • Gearing Ratios are updated quarterly. 31 of 37 REITs have their gearing ratios updated for 3Q 2024.
    • S-REITs Gearing Ratio has been on a steady uptrend. It was 35.55% in Q4 2019.
  • Highest Gearing Ratio REITs
    Manulife US REIT 58.2
    EC World REIT 57.9
    Prime US REIT 48.1
    Elite UK REIT 45.1
    Lippo Malls Indonesia Retail Trust 45.0
    Acrophyte Hospitality Trust 43.5

    MUST and EC World REIT’s gearing ratio has exceeded MAS’s gearing limit of 50%. However, the aggregate leverage limit is not considered to be breached if exceeding the limit is due to circumstances beyond the control of the REIT Manager.

Market Capitalisation Overview

  • Total Singapore REIT Market Capitalisation decreased by 6.15% to S$86.77 Billion.
    • Decreased from S$92.46 Billion in October 2024.
  • Biggest Market Capitalisation REITs (S$m):
    Capitaland Integrated Commercial Trust 13265.98
    Capitaland Ascendas REIT 11476.17
    Mapletree Pan Asia Commercial Trust 6523.64
    Mapletree Logistics Tr 6458.88
    Mapletree Industrial Tr 6000.84
    Frasers Centrepoint Trust 3834.93
  • Smallest Market Capitalisation REITs (S$m):
    Acrophyte Hospitality Trust 124.70
    Lippo Malls Indonesia Retail Trust 169.33
    Manulife US REIT 178.00
    Elite UK REIT 178.23
    Prime US REIT 214.51
    EC World REIT 226.76

Disclaimer: The above table is best used for “screening and shortlisting only”. It is NOT for investing (Buy / Sell) decision. If you want to know more about investing in REITs, scroll down for more information on the REITs courses.


Top 20 Best/Worst Performers of October 2024


Source: https://screener.reitsavvy.com/


SG 10 Year Government Bond Yield

  • SG 10 Year: 2.82% (remained at 2.82%)


Summary


Singapore REITs is currently having a pullback due a spike in US 10 years risk free rate to 4.3% (from ~3.8% early October) as the market fears the return of inflation with Trump 2.0 tariff policy.   

Fundamentally, the S-REIT sector is trading at a 13% discount to its fair value, with an average trailing twelve-month (TTM) yield of 6.50%. 

According to the current Fed Fund Rate projections from the CME Group, the market expect another 25 basis point cut by end 2024, with a total reduction of about 100 basis points  cut from the peak of the interest rate cycle. The cut in interest rate will help to boost the DPU of the REITs which have shorter debt maturity profile and higher percentage of floating rate. However, the impact will only be reflected in the financial statement of the next 1 to 2 quarter. The current weakness of the S-REIT sector will continue to be shadowed by the US 10 Year Risk Free rate which have has very strong inversed correlation with the REIT index.


US 10 Year Risk Free Rate


Kenny Loh is a Wealth Advisory Director and REITs Specialist of Singapore’s top Independent Financial Advisor. He helps clients construct diversified portfolios consisting of different asset classes from REITs, Equities, Bonds, ETFs, Unit Trusts, Private Equity, Alternative Investments, Digital Assets and Fixed Maturity Funds to achieve an optimal risk adjusted return. Kenny is also a CERTIFIED FINANCIAL PLANNER, SGX Academy REIT Trainer, Certified IBF Trainer of Associate REIT Investment Advisor (ARIA) and also invited speaker of REITs Symposium and Invest Fair.  You can join my Telegram channel #REITirement – SREIT Singapore REIT Market Update and Retirement related news. https://t.me/REITirement
Continue ReadingSingapore REITs Monthly Update (November 10th, 2024)

Singapore REITs Monthly Update (October 12th, 2024)

  • Post author:


Technical Analysis of FTSE ST REIT Index (FSTAS351020)


FTSE ST Real Estate Investment Trusts (FTSE ST REIT Index) increased from 702.98 to 700.03 (-0.32%) compared to last month’s update. Singapore REITs is currently having a pull back within an uptrend channel after a strong rally over the 2-3 months.  


  • Short-term direction: Up
  • Medium-term direction: Up
  • Long-term direction: Up
  • Immediate Support: 50D SMA (690) and 200D SMA (668)
  • Immediate Resistance 730


FTSE REIT Index Chart (2 years)


Previous chart on FTSE ST REIT index can be found in the last post: Singapore REIT Fundamental Comparison Table on September 8th, 2024.


Fundamental Analysis of 38 Singapore REITs


The following is the compilation of 38 Singapore REITs with colour-coding of the Distribution Yield, Gearing Ratio and Price to NAV Ratio.

  • The Financial Ratios are based on past data and these are lagging indicators.
  • All REITs have the latest Q2 2024 values.
  • I have introduced weighted average (weighted by market cap) to the financial ratios, in addition to the existing simple average ratios. This is another perspective where smaller market cap REITs do not disproportionately affect the average ratios.

Data from REITsavvy Screener. https://screener.reitsavvy.com/


What does each Column mean?

  • FY DPU: If Green, FY DPU for the recent 4 Quarters is higher than that of the preceding 4 Quarters. If Lower, it is Red.
  • Yield (ttm): Yield, calculated by DPU (trailing twelve months) and Current Price as of October 11th, 2024.
  • Gearing (%): Leverage Ratio.
  • Price/NAV: Price to Book Value. Formula: Current Price over Net Asset Value per Unit.
  • Yield Spread (%): REIT yield (ttm) reference to Gov Bond Yields. REITs are referenced to SG Gov Bond Yield.

As of May 2024, all REITs’ Yield Spread will be referenced to SG Gov Bond Yields, regardless of trading currency.

Price/NAV Ratios Overview

  • Price/NAV increased to 0.91 (Weighted Average: 0.91)
    • Increased from 0.89 in September 2024.
    • Singapore Overall REIT sector is slightly undervalued
  • Most overvalued REITs (based on Price/NAV)
    Keppel DC REIT 1.64
    ParkwayLife REIT 1.52
    Capitaland Ascendas REIT 1.27
    Mapletree Industrial Tr 1.21
    Mapletree Logistics Tr 1.04
    Frasers Centrepoint Trust 1.00

    EC World REIT is currently suspended, however at current Price and NAV/Unit values it has a value of 4.67 (N.M)

  • Most undervalued REITs (based on Price/NAV)
    Prime US REIT 0.33
    Keppel Pacific Oak US REIT 0.35
    Manulife US REIT 0.35
    ARA Hospitality Trust 0.36
    Lippo Malls Indonesia Retail Trust 0.40
    OUE REIT 0.43

Distribution Yields Overview

  • TTM Distribution Yield decreased to 6.23%. (Weighted Average remained at 5.91%)    
    • Decreased from 6.37% in September 2024. (Weighted Average was 5.91%)
    • 14 of 40 Singapore REITs have ttm distribution yields of above 7%.
  • Highest Distribution Yield REITs (ttm)
    IREIT Global 11.01
    ARA Hospitality Trust 10.70
    Elite Commercial REIT 9.41
    Cromwell European REIT 9.40
    EC World REIT 9.24
    First REIT 9.04

    Reminder that these yield numbers are based on current prices. 

    • Some REITs opted for semi-annual reporting and thus no quarterly DPU was announced.
    • A High Yield should not be the sole ratio to look for when choosing a REIT to invest in.
  • Yield Spread tightened to 3.40%. (Weighted Average remained similar at 4.01%)     
    • Tightened from 3.76% in September 2024. (Weighted Average was 3.99%)
    • From May 2024 onwards, all my yield spread measurements are now in relation to SG Gov Bond Yields, no longer a mix with US Gov Bond Yields.


Gearing Ratios Overview

  • Gearing Ratio remained at 39.12%. (Weighted Average: 38.28%)
    • Remained at 39.12% in September 2024. (Weighted Average: 38.28%)  
    • Gearing Ratios are updated quarterly. Therefore there were no gearing ratio updates this month.
    • S-REITs Gearing Ratio has been on a steady uptrend. It was 35.55% in Q4 2019.
  • Highest Gearing Ratio REITs
    EC World REIT 57.9
    Manulife US REIT 56.3
    Prime US REIT 48.1
    Lippo Malls Indonesia Retail Trust 45.0
    ARA Hospitality Trust 43.5
    Keppel Pacific Oak US REIT 42.7

    MUST and EC World REIT’s gearing ratio has exceeded MAS’s gearing limit of 50%. However the aggregate leverage limit is not considered to be breached if exceeding the limit is due to circumstances beyond the control of the REIT Manager.

Market Capitalisation Overview

  • Total Singapore REIT Market Capitalisation decreased by 0.11% to S$92.46 Billion.
    • Decreased from S$92.57 Billion in September 2024.
  • Biggest Market Capitalisation REITs (S$m):
    Capitaland Integrated Commercial Trust 14006.72
    Capitaland Ascendas REIT 12267.63
    Mapletree Pan Asia Commercial Trust 7570.08
    Mapletree Logistics Tr 7122.58
    Mapletree Industrial Tr 5981.85
    Frasers Logistics & Commercial Trust 4226.20
  • Smallest Market Capitalisation REITs (S$m):
    ARA Hospitality Trust 145.00
    Lippo Malls Indonesia Retail Trust 169.33
    Elite Commercial REIT 170.23
    Manulife US REIT 220.20
    EC World REIT 226.76
    Prime US REIT 234.13

Disclaimer: The above table is best used for “screening and shortlisting only”. It is NOT for investing (Buy / Sell) decision. If you want to know more about investing in REITs, scroll down for more information on the REITs courses.


Top 20 Best/Worst Performers of September 2024


Source: https://screener.reitsavvy.com/


SG 10 Year Government Bond Yield

  • SG 10 Year: 2.82% (decreased from 2.88%)


Summary


Singapore REITs is currently having a pull back within an uptrend channel after a strong rally over the 2-3 months.  

Fundamentally, the S-REIT sector is trading at an 9% discount to its fair value, with an average trailing twelve-month (TTM) yield of 6.23%. Despite the recent rally, valuations and distribution per unit (DPU) yields remain attractive. For investors who miss to enter the REITs at the market bottom in April and June, the recent pull back presents another opportunities to lock in the current yield at a discounted valuation, while awaiting a potential valuation re-rating in response to the anticipated interest rate cut by the end of 2024.

The expected cut in the U.S. interest rate and the decline in the U.S. 10-year bond yield are key catalysts that could further boost the Singapore REIT sector. According to the current Fed Fund Rate projections from the CME Group, the market expect another 50 basis point cut by end 2024, with a total reduction of about 100 basis points  cut from the peak of the interest rate cycle.


US 10 Year Risk Free Rate


Kenny Loh is a Wealth Advisory Director and REITs Specialist of Singapore’s top Independent Financial Advisor. He helps clients construct diversified portfolios consisting of different asset classes from REITs, Equities, Bonds, ETFs, Unit Trusts, Private Equity, Alternative Investments, Digital Assets and Fixed Maturity Funds to achieve an optimal risk adjusted return. Kenny is also a CERTIFIED FINANCIAL PLANNER, SGX Academy REIT Trainer, Certified IBF Trainer of Associate REIT Investment Advisor (ARIA) and also invited speaker of REITs Symposium and Invest Fair.  You can join my Telegram channel #REITirement – SREIT Singapore REIT Market Update and Retirement related news. https://t.me/REITirement
Continue ReadingSingapore REITs Monthly Update (October 12th, 2024)