Singapore REIT Monthly Update (November 13th 2022)

  • Post author:

This article is published 1 week later, to allow for all REIT earnings to be completed. All values are now updated to the latest Q3 2022 earnings / business updates.


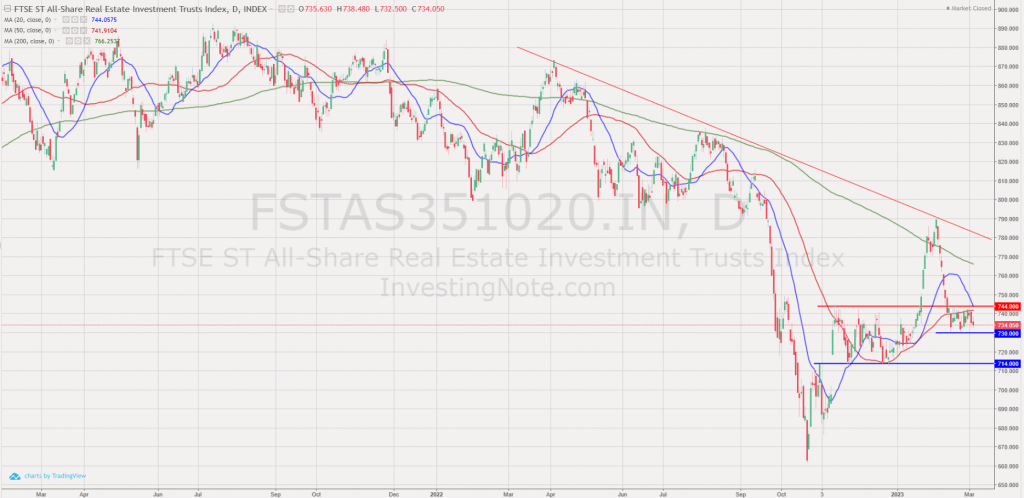
Technical Analysis of FTSE ST REIT Index (FSTAS351020)


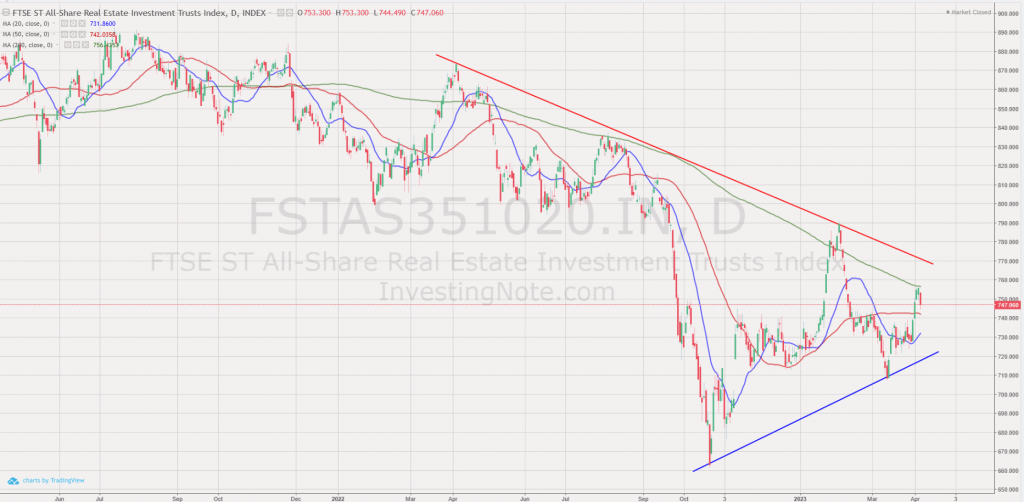
FTSE ST Real Estate Investment Trusts (FTSE ST REIT Index) decreased from 737.01 to 731.39 (-0.76%) compared to last month’s update. From October 7th to October 21st, S-REITs sold off and reaching a low of 661. The last time the REIT Index hit 661 is on April 2nd, 2020, 13 days after the March 2020 crash. However, the REIT Index rebounded strongly back to 731 on Friday, November 11th with a gap up. This is a strong reversal candlestick pattern if the FTSE ST REIT Index does not close the gap and stays above this level in the next few trading sessions.

  • Short-term direction: Up (Price Action – Gap up)
  • Medium-term direction: Down (50D SMA is sloping down)
  • Long-term direction Down (200D SMA is sloping down)
  • Immediate Support at 718.4 (Gap Resistance)
  • Immediate Resistance at 772

Chart with longer timeframe (~3 years)


Previous chart on FTSE ST REIT index can be found in the last post: Singapore REIT Fundamental Comparison Table on Oct 2nd, 2022.


Fundamental Analysis of 38 Singapore REITs


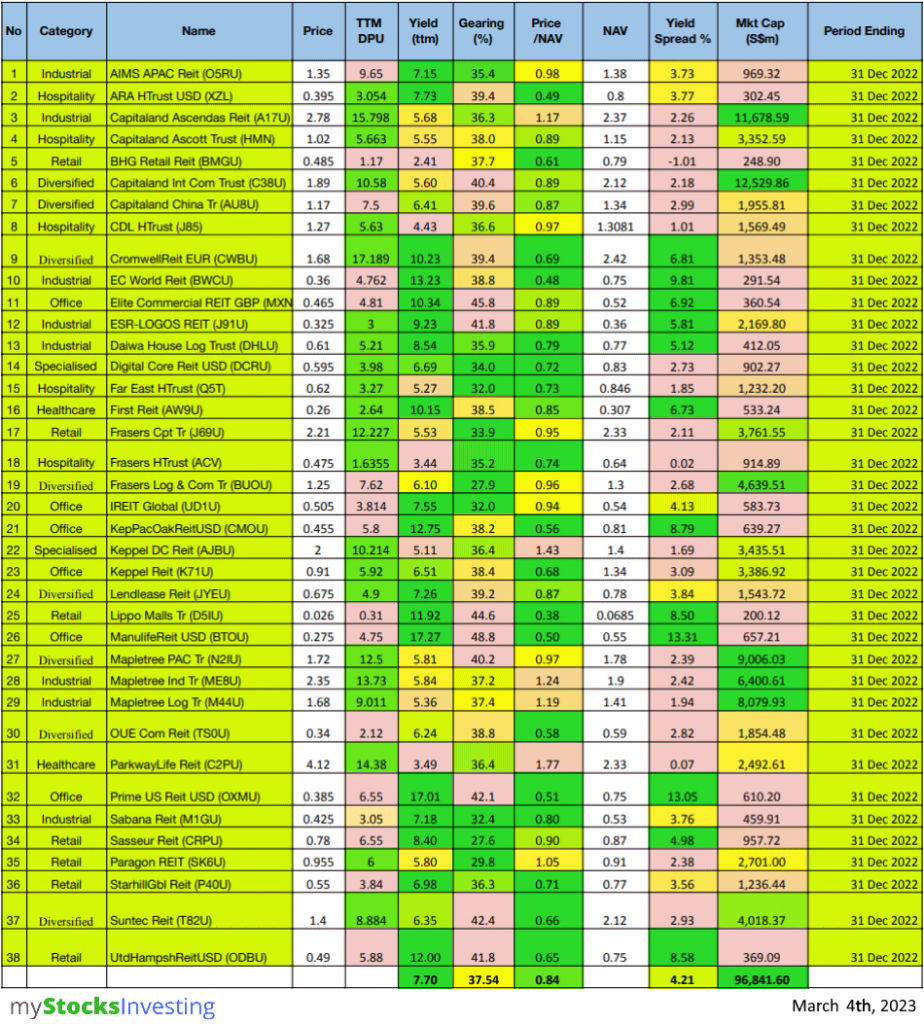
The following is the compilation of 38 Singapore REITs with colour-coding of the Distribution Yield, Gearing Ratio and Price to NAV Ratio.

  • The Financial Ratios are based on past data and there are lagging indicators.
  • This REIT table takes into account the dividend cuts due to the COVID-19 outbreak. Yield is calculated trailing twelve months (ttm), therefore REITs with delayed payouts might have lower displayed yields, thus yield displayed might be lower for more affected REITs.
  • All REITs highlighted are now updated with the latest Q3 2022 business updates/earnings.
  • Ascott Residence Trust has been renamed to Capitaland Ascott Trust. Ascendas REIT has been renamed to Capitaland Ascendas REIT.

Data from StocksCafe REIT Screener. https://stocks.cafe/kenny/advanced


What does each Column mean?

  • FY DPU: If Green, FY DPU for the recent 4 Quarters is higher than that of the preceding 4 Quarters. If Lower, it is Red.
    • Most REITs are green since it is compared to FY20/21 as the base (during the pandemic)
  • Yield (ttm): Yield, calculated by DPU (trailing twelve months) and Current Price as of November 11th 2022.
    • Digital Core REIT and Daiwa House Logistics Trust: Yield calculated from trailing six months distribution, TTM yield is annualised.
  • Gearing (%): Leverage Ratio.
  • Price/NAV: Price to Book Value. Formula: Current Price over Net Asset Value per Unit.
  • Yield Spread (%): REIT yield (ttm) reference to Gov Bond Yields. REITs trading in USD is referenced to US Gov Bond Yield, everything else is referenced to SG Gov Bond Yield.
  •  

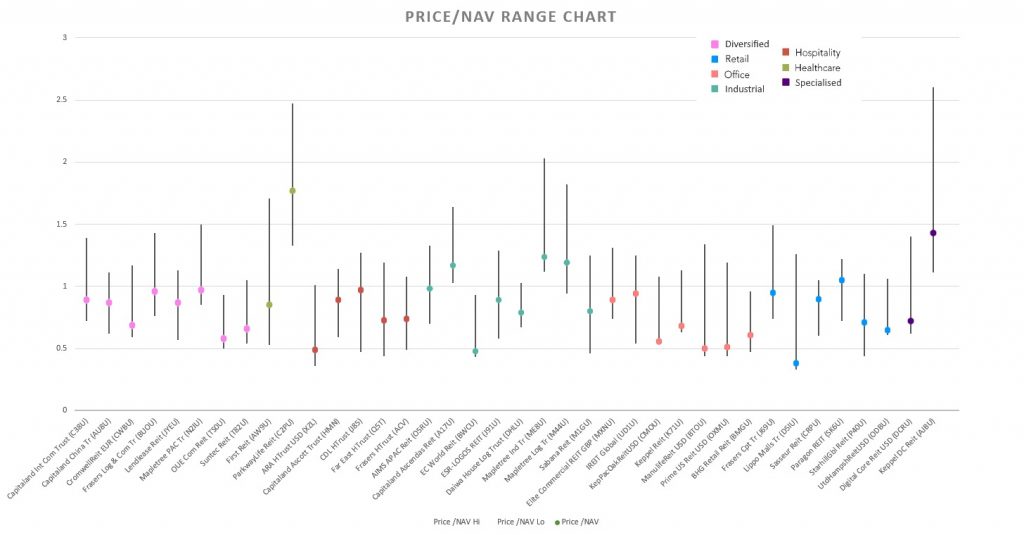
Price/NAV Ratios Overview

  • Price/NAV decreased to 0.81.
    • Decreased from 0.83 from October 2022.
    • This is due to the recent sell-off.
    • Singapore Overall REIT sector is undervalued now.
    • Take note that NAV is adjusted upwards for some REITs due to pandemic recovery.
  • Most overvalued REITs (based on Price/NAV)
    • Parkway Life REIT (Price/NAV = 1.75)
    • Keppel DC REIT (Price/NAV = 1.34)
    • Mapletree Industrial Trust (Price/NAV = 1.19)
    • Capitaland Ascendas REIT (Price/NAV = 1.15)
    • Mapletree Logistics Trust (Price/NAV = 1.10)
    • Mapletree PAC Trust (Price/NAV = 0.98)
    • Only 5 REITs are overvalued now based on Price/NAV value.
  • Most undervalued REITs (based on Price/NAV)
    • Lippo Malls Indonesia Retail Trust (Price/NAV=0.36)
    • ARA Hospitality Trust (Price/NAV = 0.52)
    • Manulife US REIT (Price/NAV = 0.54)
    • BHG Retail REIT (Price/NAV = 0.57)
    • EC World REIT (Price/NAV = 0.57)
    • OUE Commercial REIT (Price/NAV = 0.60)

Distribution Yields Overview

  • TTM Distribution Yield Increased to 7.58%.
    • Increased from 7.30% in October 2022.
    • 18 of 40 Singapore REITs have distribution yields of above 7%. (same as last month’s update)
    • Do take note that these yield numbers are based on current prices taking into account the delayed distribution/dividend cuts due to COVID-19, and economic recovery. The recent sell-off contributed to the increase in average yield.
    • 9 REITs have a ttm yield of over 10%!
  • Highest Distribution Yield REITs (ttm)
    • Manulife US REIT (13.97%)
    • Prime US REIT (13.53%)
    • EC World REIT (12.46%)
    • United Hampshire US REIT (11.92%)
    • Lippo Malls Indonesia Retail Trust (11.61%)
    • Keppel Pacific Oak US REIT (10.88%)
    • Reminder that these yield numbers are based on current prices taking into account delayed distribution/dividend cuts due to COVID-19.
    • Some REITs opted for semi-annual reporting and thus no quarterly DPU was announced.
    • A High Yield should not be the sole ratio to look for when choosing a REIT to invest in.
  • Yield Spread widened to 4.17%.
    • Increased from 3.76% in October 2022.

Gearing Ratios Overview

  • Gearing Ratio increased to 37.03%. 
    • Increased from 36.68% in October 2022.
    • Gearing Ratios are updated quarterly.
  • Highest Gearing Ratio REITs
    • Lippo Malls Indonesia Retail Trust (43.7%)
    • ARA Hospitality Trust (43.3%)
    • Suntec REIT (43.1%)
    • Manulife US REIT (42.5%)
    • United Hampshire US REIT (42.1%)
    • Elite Commercial REIT (41.9%)

Market Capitalisation Overview

  • Total Singapore REIT Market Capitalisation decreased by 0.3% to S$96.23 Billion.
    • Decreased from S$96.52 Billion in October 2022.
  • Biggest Market Capitalisation REITs:
    • Capitaland Integrated Commercial Trust ($3.52B)
    • Ascendas REIT ($11.59B)
    • Mapletree Pan Asia Commercial Trust ($8.64B)
    • Mapletree Logistics Trust ($7.73B)
    • Mapletree Industrial Trust ($6.22B)
    • Frasers Logistics & Commercial Trust ($4.36B)
    • No change in the rankings since September 2022.
  • Smallest Market Capitalisation REITs:
    • Lippo Malls Indonesia Retail Trust ($239M)
    • BHG Retail REIT ($257M)
    • ARA Hospitality Trust ($289M)
    • EC World REIT ($368M)
    • United Hampshire US REIT ($384M)
    • Elite Commercial REIT ($392M)

Disclaimer: The above table is best used for “screening and shortlisting only”. It is NOT for investing (Buy / Sell) decision. If you want to know more about investing in REITs, here’s a subsidised 2-day course with all you need to know about REITs and how to start investing in them.


Top 20 Worst Performers of the Month in October 2022


 (Source: https://stocks.cafe/kenny/advanced)


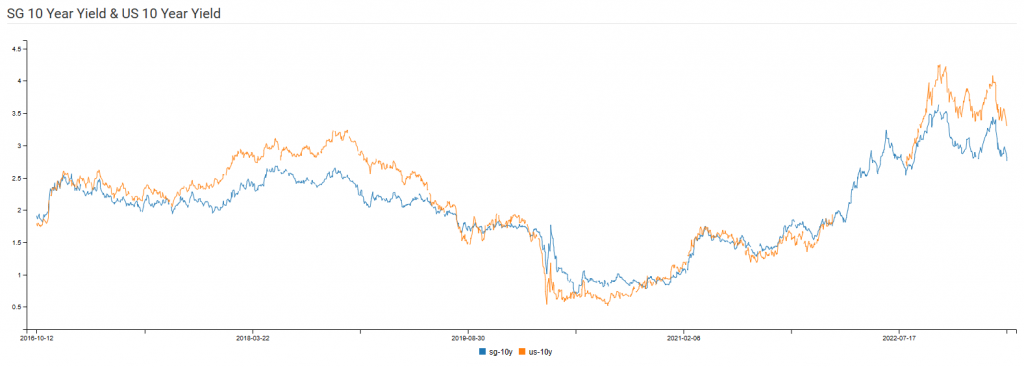
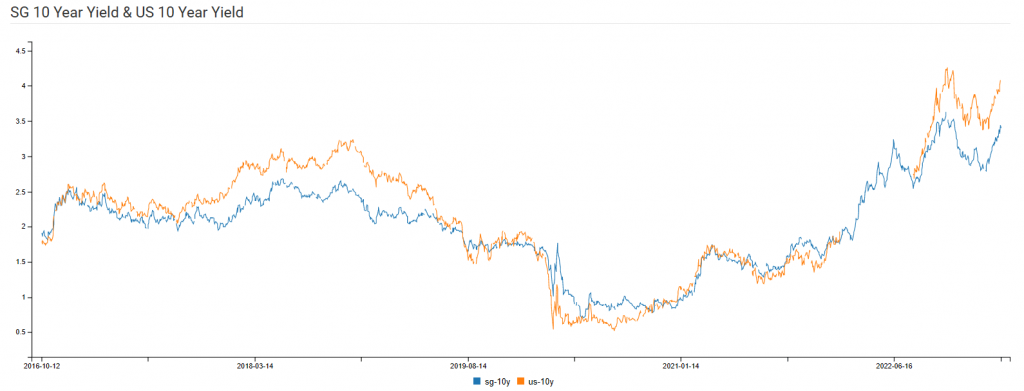
SG 10 Year & US 10 Year Government Bond Yield

  • SG 10 Year: 3.48% (decreased from 3.49%)
  • US 10 Year: 3.82% (decreased from 3.84%)


Major REIT News in October 2022


S-REITs Earnings Season for the Period Ending 30 Sep 2022 has wrapped up

All S-REITs have finished reporting their earnings. Of the 16 REITs who reported their earnings for Q1 and/or Q2 (taking most recent DPU) (excl. DC REIT), the overview on Q-o-Q or H-o-H DPU change are as follows:

4 REITs have reported an increase in DPU,

3 REITs have reported no change in DPU, and

9 REITs have reported a decrease in DPU.


Summary


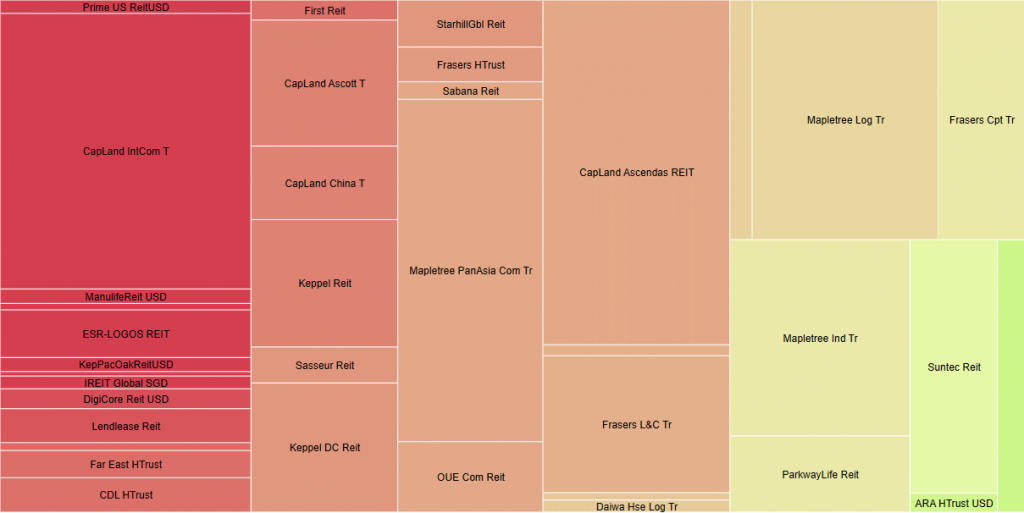
Fundamentally, the whole Singapore REITs landscape is very undervalued based on the average Price/NAV (at 0.81) value of the S-REITs, which is quite rare that S-REIT is trading at such huge discount with a very attractive DPU yield of 7.58%! This is even higher than as of last month. Below is the market cap heat map for the past 1 month. The performance of REITs are evenly split. 18 REITs have been bullish while 17 REITs have been bearish the last 30 days. There is no clear correlation with market cap in terms of performance.


(Source: https://stocks.cafe/kenny/overview)

Yield spread (in reference to the 10-year Singapore government bond yield of 3.48% as of 11th November 2022) widened from 3.76% to 4.17%. This is a huge increase of 0.41%. The S-REIT Average Yield increased from 7.30% to 7.58%. Government Bond Yields remained relatively unchanged. This resulted in the widening of the yield spread. 

Technically, FTSE ST REIT Index is currently in a bearish territory but rebounded strongly from the support level. Based on the past chart patterns, REIT Index used to have a strong V-shaped rebound when there was a huge sell off with a very attractive valuation & DPU yield. Will the history repeat itself and can the S-REIT Index stage a strong rebound from this level? It remains to be seen. However, the Reward/Risk Ratio look quite attractive both fundamentally and technically. Investors can start to do some bottom fishing on the fundamentally strong REITs by locking in the current share price and high DPU yield.


Note: This above analysis is for my own personal research and it is NOT a buy or sell recommendation. Investors who would like to leverage my extensive research and years of Singapore REIT investing experience can approach me separately for a REIT Portfolio Consultation.

Kenny Loh is an Associate Wealth Advisory Director and REITs Specialist of Singapore’s top Independent Financial Advisor. He helps clients construct diversified portfolios consisting of different asset classes from REITs, Equities, Bonds, ETFs, Unit Trusts, Private Equity, Alternative Investments, Digital Assets and Fixed Maturity Funds to achieve an optimal risk adjusted return. Kenny is also a CERTIFIED FINANCIAL PLANNER, SGX Academy REIT Trainer, Certified IBF Trainer of Associate REIT Investment Advisor (ARIA) and also invited speaker of REITs Symposium and Invest Fair.  You can join my Telegram channel #REITirement – SREIT Singapore REIT Market Update and Retirement related news. https://t.me/REITirement

Continue ReadingSingapore REIT Monthly Update (November 13th 2022)

Singapore REIT Monthly Update (October 2nd 2022)

  • Post author:


Technical Analysis of FTSE ST REIT Index (FSTAS351020)


FTSE ST Real Estate Investment Trusts (FTSE ST REIT Index) decreased from 792.62 to 737.01 (-7.02%) compared to last month’s update. A huge sell-off occurred after the supports were broken and sent the REIT index towards the 2 years low on September 30th at 718. The previous time the REIT Index was at 718 was back in April 2020. A slight rebound to 737 then occurred and a down trend channel has formed.

  • Short-term direction: Down (MA) but may rebound (based on candlestick pattern)
  • Medium-term direction: Down
  • Long-term direction: Down
  • Immediate Support at 720
  • Immediate Resistance at 800

Normal Timeframe chart (~2 years)

For the past 2 selloffs, it has been followed by a V-Shaped recovery.

Previous chart on FTSE ST REIT index can be found in the last post: Singapore REIT Fundamental Comparison Table on Sept 3rd, 2022.

Fundamental Analysis of 38 Singapore REITs


The following is the compilation of 38 Singapore REITs with colour-coding of the Distribution Yield, Gearing Ratio and Price to NAV Ratio.

  • The Financial Ratios are based on past data and there are lagging indicators.
  • This REIT table takes into account the dividend cuts due to the COVID-19 outbreak. Yield is calculated trailing twelve months (ttm), therefore REITs with delayed payouts might have lower displayed yields, thus yield displayed might be lower for more affected REITs.
  • All REITs are now updated with the latest Q2 2022 business updates/earnings.
  • Since MPACT started trading, values shown below (except price and market cap) are of MCT.
  • Ascott Residence Trust has been renamed to Capitaland Ascott Trust. Ascendas REIT has been renamed to Capitaland Ascendas REIT.

Data from StocksCafe REIT Screener. https://stocks.cafe/kenny/advanced


What does each Column mean?

  • FY DPU: If Green, FY DPU for the recent 4 Quarters is higher than that of the preceding 4 Quarters. If Lower, it is Red.
    • Most REITs are green since it is compared to FY20/21 as the base (during the pandemic)
  • Yield (ttm): Yield, calculated by DPU (trailing twelve months) and Current Price as of September 30th, 2022
    • Digital Core REIT: Yield calculated from IPO Prospectus.
    • Daiwa House Logistics Trust: Yield calculated from trailing six months distribution.
  • Gearing (%): Leverage Ratio.
  • Price/NAV: Price to Book Value. Formula: Current Price (as of September 30th, 2022) over Net Asset Value per Unit.
  • Yield Spread (%): REIT yield (ttm) reference to Gov Bond Yields. REITs trading in USD is referenced to US Gov Bond Yield, everything else is referenced to SG Gov Bond Yield.
  •  

Price/NAV Ratios Overview

  • Price/NAV decreased to 0.83.
    • Decreased from 0.91 from September 2022.
    • This is due to the recent sell-off.
    • Singapore Overall REIT sector is undervalued now.
    • Take note that NAV is adjusted upwards for some REITs due to pandemic recovery.
  • Most overvalued REITs (based on Price/NAV)
    • Parkway Life REIT (Price/NAV = 1.76)
    • Mapletree Industrial Trust (Price/NAV = 1.27)
    • Keppel DC REIT (Price/NAV = 1.24)
    • Ascendas REIT (Price/NAV = 1.13)
    • Mapletree Logistics Trust (Price/NAV = 1.06)
    • Mapletree PAC Trust (Price/NAV = 0.99)
    • Only 5 REITs are overvalued now based on Price/NAV value.
  • Most undervalued REITs (based on Price/NAV)
    • Lippo Malls Indonesia Retail Trust (Price/NAV=0.41)
    • ARA Hospitality Trust (Price/NAV = 0.53)
    • EC World REIT (Price/NAV = 0.60)
    • OUE Commercial REIT (Price/NAV = 0.60)
    • IREIT Global (Price/NAV = 0.60)
    • Manulife US REIT (Price/NAV = 0.61)

Distribution Yields Overview

  • TTM Distribution Yield Increased to 7.30%.
    • Increased from 6.58% in September 2022.
    • 18 of 40 Singapore REITs have distribution yields of above 7%. (3 more than last month’s update)
    • Do take note that these yield numbers are based on current prices taking into account the delayed distribution/dividend cuts due to COVID-19, and economic recovery. The recent sell-off contributed to the increase in average yield.
    • 8 REITs have a ttm yield of over 10%!
  • Highest Distribution Yield REITs (ttm)
    • Prime US REIT (12.91%)
    • Manulife US REIT (12.33%)
    • EC World REIT (11.94%)
    • Elite Commercial REIT (11.40%)
    • Keppel Pacific Oak US REIT (11.27%)
    • United Hampshire US REIT (11.14%)
    • Reminder that these yield numbers are based on current prices taking into account delayed distribution/dividend cuts due to COVID-19.
    • Some REITs opted for semi-annual reporting and thus no quarterly DPU was announced.
    • A High Yield should not be the sole ratio to look for when choosing a REIT to invest in.
  • Yield Spread widened to 3.76%.
    • Increased from 3.50% in September 2022.

Gearing Ratios Overview

  • Gearing Ratio remained at 36.68%. 
    • Remained at 36.68% in September 2022.
    • Gearing Ratios are updated quarterly. No REITs have released business updates / earnings in the past month, therefore there is no change.
  • Highest Gearing Ratio REITs
    • Lippo Malls Indonesia Retail Trust (43.9%)
    • ARA Hospitality Trust (43.5%)
    • Suntec REIT (43.1%)
    • Manulife US REIT (42.4%)
    • Elite Commercial REIT (41.9%)
    • ESR-LOGOS REIT (40.6%)

Market Capitalisation Overview

  • Total Singapore REIT Market Capitalisation decreased by 6.75% to S$96.52 Billion.
    • Decreased from S$103.51 Billion in September 2022.
    • S-REIT Market Cap has fallen below S$100 Billion.
  • Biggest Market Capitalisation REITs:
    • Capitaland Integrated Commercial Trust ($12.73B)
    • Ascendas REIT ($11.30B)
    • Mapletree Pan Asia Commercial Trust ($9.00B)
    • Mapletree Logistics Trust ($7.47B)
    • Mapletree Industrial Trust ($6.40B)
    • Frasers Logistics & Commercial Trust ($4.55B)
    • No change compared to last month’s update.
  • Smallest Market Capitalisation REITs:
    • Lippo Malls Indonesia Retail Trust ($277M)
    • BHG Retail REIT ($277M)
    • ARA Hospitality Trust ($310M)
    • Elite Commercial REIT ($05M)
    • EC World REIT ($460M)
    • United Hampshire REIT ($429M)

Disclaimer: The above table is best used for “screening and shortlisting only”. It is NOT for investing (Buy / Sell) decision. If you want to know more about investing in REITs, here’s a subsidised 2-day course with all you need to know about REITs and how to start investing in them.


Top 20 Worst Performers of the Month in September 2022


 (Source: https://stocks.cafe/kenny/advanced)


SG 10 Year & US 10 Year Government Bond Yield

  • SG 10 Year: 3.49% (decreased from 3.07%)
  • US 10 Year: 3.84% (decreased from 3.19%)


Major REIT News in September 2022


SINGAPORE BUSINESS REVIEW: The names of property firms, Ascendas Real Estate Investment Trust (Reit), Ascott Residence Trust (ART), and Ascendas India Trust, were modified as well as their managers. 

According to a company announcement, Ascendas REIT was changed to CapitaLand Ascendas REIT (CLAR), ART was renamed to CapitaLand Ascott Trust (CLAS), and Ascendas India Trust’s name was revised to CapitaLand India Trust (CLINT).

In addition to this, CLAR’s manager is CapitaLand Ascendas REIT Management Limited, CLAR’s Reit manager is CapitaLand Ascott Trust Management Limited whilst its business trust trustee-manager is CapitaLand Ascott Business Trust Management Pte. Ltd., and CLINT’s manager is CapitaLand India Trust Management Pte. Ltd.

The revisions took effect on 27 September 2022. Read article here


Summary


Fundamentally, the whole Singapore REITs landscape is very undervalued based on the average Price/NAV (at 0.83) value of the S-REITs, which is quite rare that S-REIT is trading at such huge discount with a very attractive DPU yield of 7.3%! Below is the market cap heat map for the past 1 month. Generally, S-REITs in the past month have decreased in market cap. August and September has been a bearish month for S-REITs. The sole bullish REIT for this month is BHG Retail Reit (+3.85%).


(Source: https://stocks.cafe/kenny/overview)

Yield spread (in reference to the 10 year Singapore government bond yield of 3.49% as of 30th September 2022) widened from 3.50% to 3.76%. The S-REIT Average Yield increased from 6.58% to 7.30%, while the Average S-REIT Yield increase due to the sell-off more than offsets the increase in Government Bond Yield. This resulted in the widening of the yield spread. 

Despite the bearish month of September, S-REITs have been resilient (compared to other asset classes) and have one of the highest risk-adjusted dividend yields compared to other stock exchanges.


Technically, FTSE ST REIT Index is currently in a bearish territory and rebounded from the support level. Based on the past chart patterns, REIT Index used to have a strong V-shaped rebound and surpass the previous high after the huge sell off. Will the history repeat itself and can the S-REIT Index stage a strong rebound from this level? It remains to be seen. However, the Reward/Risk Ratio look quite attractive both fundamentally and technically.


Register my next REIT webinar here. 

How to Build a REIT Portfolio into a Retirement Plan? (SGX Academy Webinar, 5th October 2022)


Note: This above analysis is for my own personal research and it is NOT a buy or sell recommendation. Investors who would like to leverage my extensive research and years of Singapore REIT investing experience can approach me separately for a REIT Portfolio Consultation.

Kenny Loh is an Associate Wealth Advisory Director  and REITs Specialist of Singapore’s top Independent Financial Advisor. He helps clients construct diversified portfolios consisting of different asset classes from REITs, Equities, Bonds, ETFs, Unit Trusts, Private Equity, Alternative Investments, Digital Assets and Fixed Maturity Funds to achieve an optimal risk adjusted return. Kenny is also a CERTIFIED FINANCIAL PLANNER, SGX Academy REIT Trainer, Certified IBF Trainer of Associate REIT Investment Advisor (ARIA) and also invited speaker of REITs Symposium and Invest Fair.  You can join my Telegram channel #REITirement – SREIT Singapore REIT Market Update and Retirement related news. https://t.me/REITirement
Continue ReadingSingapore REIT Monthly Update (October 2nd 2022)

Money & Me: Further Interest Rate Hikes, FHT’s failed Privatization bid

  • Post author:

16 September 2022

Money and Me: What could unitholders responsible for FHT’s failed privatisation bid be holding out for?

Frasers Hospitality Trust, suffered a 24 percent dip in share prices after a $1.35 billion proposal to take the trust private fell through.. The privatisation offer seemed generous enough,– at a 7 per cent premium to net asset value (NAV) But earlier this week, the global hotel and serviced residence trust clocked in 74.88 percent of shareholder votes who were in favour of the proposal, narrowly missing the 75 per cent needed for the resolution to pass. Many market watchers were surprised including our guest Kenny Loh, REIT Specialist and Independent Financial Advisor.

We find out why and ask if hospitality Reits listed in Singapore – which have seen a remarkable revival in fortunes-  can continue their march forward. Michelle Martin and Kenny Loh also take a closer look at the S-reit landscape month-on-month performance across sectors.

The article version (transcribed) of the interview can be found below.


Transcription:

Introduction

We’re surveying the REIT universe. Frasers Hospitality Trust suffered a 24% dip in its share price, after a 1.35 billion proposal to take the trust private fell even though the offer seemed generous. Cash offering of 70 cents per stapled security, a 7% premium to its net asset value by sponsor Fraser’s Property.

But the global hotel and service resident clocked in 74.88% of shareholder votes, just missing 75% that it needed for that resolution to pass. So we’ll take a closer look at that. Also scanning Mapletree Pan Asia commercial trust, seeing a bullish call by DBS on its share price. And in just a while, we’ll also take a look at Parkway Life REIT and their move to further expand their Healthcare REITs portfolio over in Japan. 


Q. Can you give us a sense of an overview of how REITs have performed the past month? I understand that the year’s best performers are hospitality trusts and the worst performers are REITs with 100% overseas assets.

Right based on the latest month of performance, actually, there’s a sell off across the board for the whole REIT universe in Singapore. And based on last week, with inflation data coming out, there was a sell off in the US Stock market, and Singapore REITs are not spared too. And if we are looking at a whole index itself, the REIT index is really forming some sort of bearish chart pattern, the falling wedge. This I don’t like as an investor, as the breaking down the support of this may result in a larger sell off of the Singapore itself.

So, last month was a pretty bad month for Singapore REITs. And at a present moment, the REIT index is holding at the critical support level.


Q. For the failed Frasers Hospitality Trust privatisation bid, why do you think unitholders rejected this privatisation bid, despite the attractive offer?

I was surprised unitholders rejected this privatization. I thinkthe offer is pretty good based on past performance. I think why the unit holder they rejected the offer, I think is all down to the price. Because if you look at a price chart, historically Frasers Hospitality Trust used to trade between 63 cents to 86 cents.

And close to 70% of the time, they are trading above 70 cents value, which means that most investors who invested in Fraser Hospitality Trust, basically they’re losing money. And coupled with a dividend, maybe some of them probably would breakeven with the share price and also the dividend from a total return perspective.

So I think that mainly on a price perspective, but however, It is actually a narrow miss of 75% mark because the 74.88% who voted for the prioritization is only 0.12%, which a small number. So I think that with the adjustment of the share price during the next attempt, probably you’ll swing these unitholders to vote for the privatisation.


Q. What would privatization mean for unitholders of FHT?

There are two scenarios. One scenario is a privatisation does not go through. Based on the current portfolio, I think there are a lot of challenges for FCT to turn around because there will be too much uncertainty, e.g. Rate hike and inflation. Also by looking at their debt portfolio they may have to face the refinancing risk pretty soon, because they currently have a high gearing ratio of 39.3%. And at the same time, they have a decreasing DPU trend, even during pre-COVID. So is the NAV/Unit value.

This means that fundamentally, I think the current portfolio is not a fundamentally strong portfolio. Coupled with all these uncertainties, if shareholders continue to hold onto FHT and FHT faces refinancing risks, they will then have to issue additional rights. And that will further dilute the DPU and also the share price. Although the sentiment in the Hospitality REITs recovery is good, there are better choices out there.

For example, CDL Hospitality Trusts, Far East Hospitality Trust and Ascott Residence Trust. If you look at the offering price itself, they are offering 1.07 times of the NAV (book value), which is pretty high at the present moment. Ascott is only trading at 0.94, FEHT at 0.7 and CDLHT at 0.97. The principal is much higher than those relatively better Hospitality trusts out there.


Q. What are the possible headwinds for FHT that you see?

One would be the continual decrease of DPU. The other possible concern would be the resurgence of COVID around the world, which will dent the hospitality sector. And at the present moment, the ICR is also pretty low. I may have a concern that they may turn out to be the next Eagle Hospitality Trust, where they are not able to pay the dividends.


Q. Mapletree Pan Asia Commercial Trust is trading at a yield aboe 5%, at $0.89, with a bullish call by DBS. Do you think MPACT’s valuation is attractive right now?

I do agree with the DBS call because if you look at the present price to book value, it is trading below or close to minus one standard division of the five year average. In other words, it’s undervalued. And if you look at the forward earnings and the forward DPU, the forward DPU is expected to rise.

2 reasons: one attributed to the future easing of restrictions for Hong Kong and China. Eventually China will ease COVID restrtctions. And Festival Walk, one of the famous retail malls in Hong Kong, definitely will be benefit from this reopening and reduction on quarantine measures. Festival Walk contributed 21% of MPACT’s NPI. So a reopening of a China will help, uh, Hong Kong itself.

And at the same time, also we will help Singapore because right now we have very few Chinese tourists coming to Singapore due to all the restrictions. When the borders reopen, there’ll be revenge traveling. We have seen it for Singapore. Once it opens, everyone goes out. We don’t even care about air ticket prices. They’ll come here and perform revenge traveling and revenge spending. This will help VivoCity, which contributes close to 22% of the NPI.

So if you combine this two major properties, that is a 43% contribution to NPI benefitted from the reopening.


Q. When it comes to MPACT, do you see any possible risks ahead that investors should be aware of?

Yes. Yes, there, there are risks. After the merger. There are two risks in this expect. One of them is a fundamental risk. So the fundamental side, if we have a slower than expected reopening of China and Hong Kong, or we are entering into a severe recession because now everybody is talking about recession. A severe recession will defnitely impact DPU. That is more on the fundamental side.

The other aspect is the political aspect because we know that now tension is pretty high between US and China on the Taiwan issue. So if any incident creates a war, maybe they just fire the missile out to each other. Right. Or they have a sanction on China or sanction on Hong Kong or whatever thing, definitely you affect the sentiment of the investment community.


Q: Do you think these latest acquisitions are a positive for ParkwayLife REIT’s portfolio? PLREIT has recently acquired 3 Hokkaido nursing homes.

Yes. positive because with the current high price to book value, about 1.94 times, and also the low DPU yield of about 3%, any acquisition out there would be quite attractive because definitely it’ll be much better than the current valuation and also the DPU.

This acquisition actually is yield-accretive. They are getting 6.5% NPI yield. And at the same time, the valuation of this property is 12% below the valuation compared to the REIT valuation itself, it is pretty attractive. There definitely be a retating after the portfolio to be integrated into the REIT.

And at the same time, a very low cost of debt. You just imagine that you are borrowing with an interest rate of close to 0%, and you are investing in some properties generating 6.5%. The spread is huge. It’s really a no brainer. 


Q. Can you help us understand how PLREIT has been performing compared to pre-COVID levels?

Yeah, it, it really depends on each investor. When was their investment time? Five years ago. Definitely. This is one, this is one of the best REITs. But if its only for just after COVID or maybe one year ago, probably performance is not so fantastic but still quite good.

So I’m just referring to the, the, before the COVID and also based on the past five year, if you come just purely come back to the previous high of the pre COVID at the present stock price, it has already surpassed the previous pre-COVID high up by 25%. Other REITs do not have this kind of performance.

Yeah, because REITs at the present moment is coming down, and subjected to sector rotation. At the same time, the DPU has been growing steadily over year since the IPO and PLREIT is unscathed during the COVID period, they continue to pay good dividend, continue to grow that dividend, due to the strength in the underlying portfolio that’s why they’re able to combine such a high premium to the book value at the same time that did not go to the correction during this period.

Q. What is your feel of the recessionary headwind? And what could this mean for REITs?

Investors need to be selective in this case because during the recession period, most of the companiesthey’ll be going through cost cutting measures. First of all, they’ll try to reduce expense. Secondly, they start to cut headcounts. Thirdly, they may shut down the facilities. Tenant profile is important. If the tenant profiles are very strong, they’re quite reputable and they are in essential industries, definitely they can tide through this recession pretty well.

The Logistics and Industrial sector probably is more defensive at this time. Healthcare is also defensive. I think Singapore should be able to avoid the recession. So retail malls in Singapore, they’re probably more resilient in nature because we cannot live without retail malls.

Nowhere to go, nowhere to eat, nothing to do. If we are entering a recession, everyone will be tightening their belts. The hospitality sector will be impacted. Tourism will be affected. But at the same time, there is a revenge spending phenomena when China reopens, because everyone there have been locked down for three years. Right? You, you just imagine the potential explosion of the needs to spend and to travel that may maybe kick start and help us in the recovery of the global economy. 


Navigating Volatile Markets to Beat Inflation (Physical Seminar 1st October 2022)


Worried about the high inflation rates? Join us as we share tips on how to beat inflation, and our inflation outlook for the rest of the year and beyond. You will learn ways to edit your investment portfolio to beat the high inflation rates, in a SAFE way.

As this is a physcial seminar, seats are limited so sign up today.

Date: 1st October 2022 (Saturday)

Time: 10am – 12pm

Venue: Gateway West (150 Beach Road, #12-01/08, Singapore 189720)


How to Build a REIT Portfolio into a Retirement Plan? (SGX Academy Webinar, 5th October 2022)


Want to learn the fundamentals of what REITs are, and how can this asset class complement your investment portfolio? Why should you invest in this asset class with an average p.a. yield of 5-7% and $100 minimum investment amount? Tune in to learn how to kickstart/improve your REITs investing!


Date: 5th October 2022 (Wednesday)

Time: 7pm – 830pm

Venue: Online


Listen to his previous market outlook interviews here:

2022

2021

2020

Kenny Loh is an Associate Wealth Advisory Director and REITs Specialist of Singapore’s top Independent Financial Advisor. He helps clients construct diversified portfolios consisting of different asset classes from REITs, Equities, Bonds, ETFs, Unit Trusts, Private Equity, Alternative Investments, Digital Assets and Fixed Maturity Funds to achieve an optimal risk adjusted return. Kenny is also a CERTIFIED FINANCIAL PLANNER, SGX Academy REIT Trainer, Certified IBF Trainer of Associate REIT Investment Advisor (ARIA) and also invited speaker of REITs Symposium and Invest Fair.  

You can join my Telegram channel #REITirement – SREIT Singapore REIT Market Update and Retirement related news. https://t.me/REITirement

Continue ReadingMoney & Me: Further Interest Rate Hikes, FHT’s failed Privatization bid